Last week: The week started with US$ weakness and this triggered some bullish movement on the usual suspects of the E/U, A/U, Cable and Kiwi but, interestingly, these moves did not come with new TC signals. I suspect that divergence on the FX indices at that point in time contributed to this. To that end, I had suggested last week that the cross-pairs might offer better opportunities under these circumstances and I was especially interested in the EUR/NZD given it had made a recent trend line break. Sadly, for me though, I missed a LONG TC signal on this pair due to time-zone issues and the move went on to give over 550 pips. I’m aware that some of you caught part of this move so that is some comfort!
This week:
The US$ continued to weaken last week and there has now been a weekly close below key 95.50 supporting a bearish ‘Double Top’ breakdown. However, there is a lot of high impact US data next week that may dictate whether the index will hold below this broken 95.50 level: US Trade Balance, ISM Non-Manufacturing data, a Fed-Chair Janet Yellen speech, weekly Unemployment Claims and this is all capped off with the big kahuna item of them all being Non-Farm Payrolls on Friday. Thus, I will be watching to see if the index will hold below 95.50 following all of this news. Strange as it seems the FX indices are now aligned for ‘Risk on’ and I’ll be watching to see if stocks and commodities follow suit. An update on the FX Indices can be found through this link.
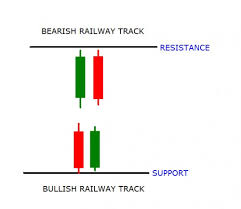
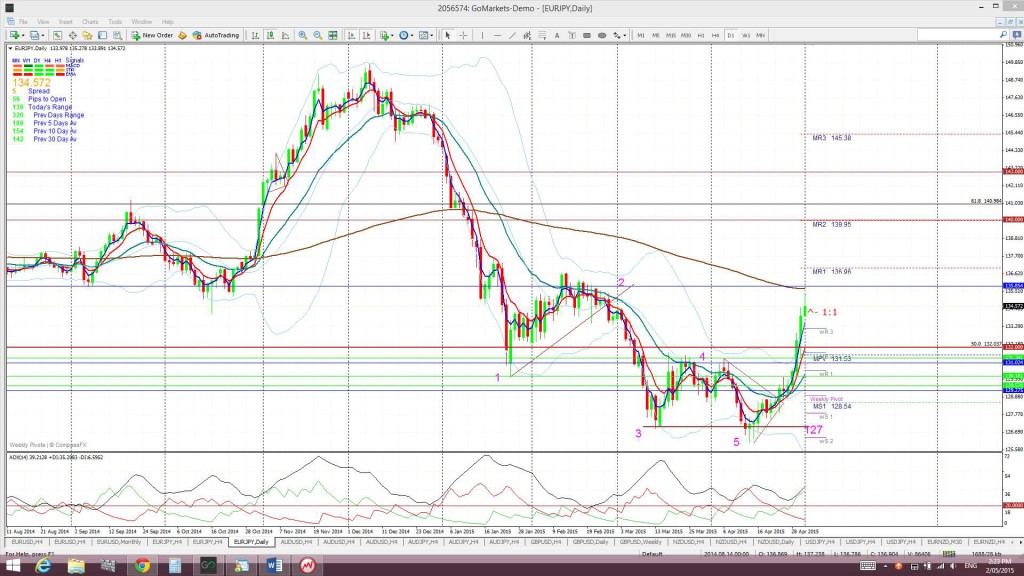
The E/U and E/J both closed with bullish-reversal ‘Railway Track’ patterns for April. This might be in the ‘weird but true’ category but traders need to keep an open mind and look for signs of bullish continuation.
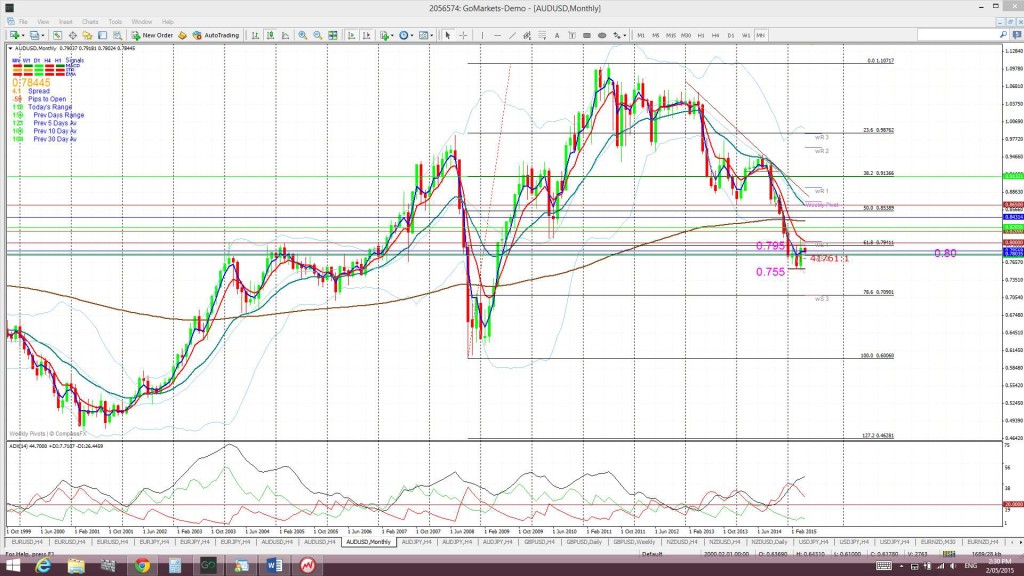
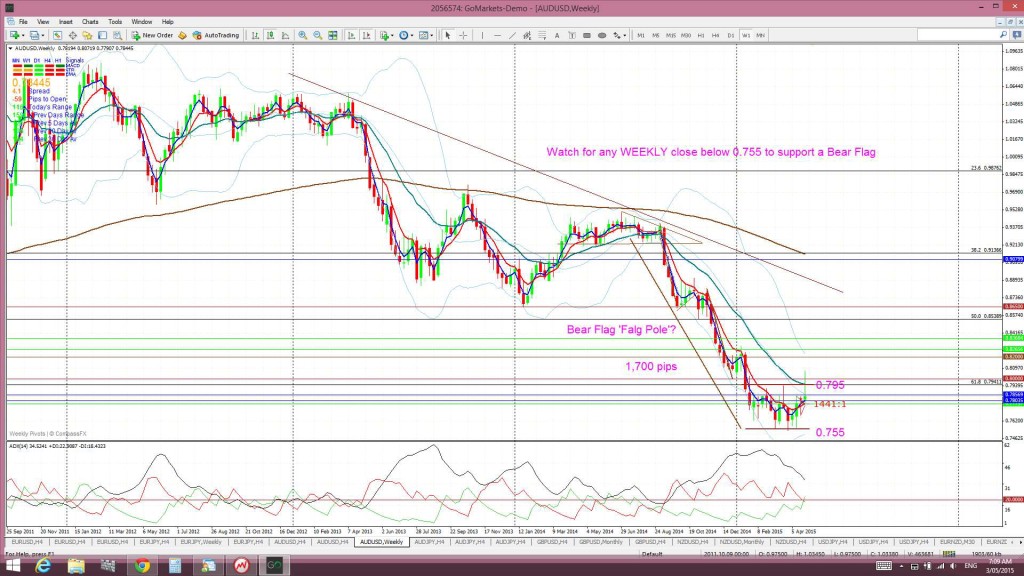
AUD/USD: closed the month of April with a bullish ‘engulfing’ candle. The RBA might undermine this next week with an interest rate cut that could trigger a 1,700 pip Bear Flag breakout. Technical traders should keep this in mind but there is an awful lot of other data next week that can impact this pair.
AUD/NZD: this pair might be hinting at some divergence to come between the AUD and NZD. Divergence here, if it evolves, has consequences for some of the cross-pairs.
U/J: printed another small monthly candle but it was almost a bearish ‘engulfing’ candle.
Cable: This is heading into unknown territory this week with the UK election on Thursday May 7th. I wouldn’t be surprised if there was a relief rally if the Conservatives retain power given the fear-mongering that has been spread about the situation with Labour and the SNP.
Silver & Gold: both metals continue to chop sideways above major support whilst they seem to wait to see which way the US$ is going to head next.
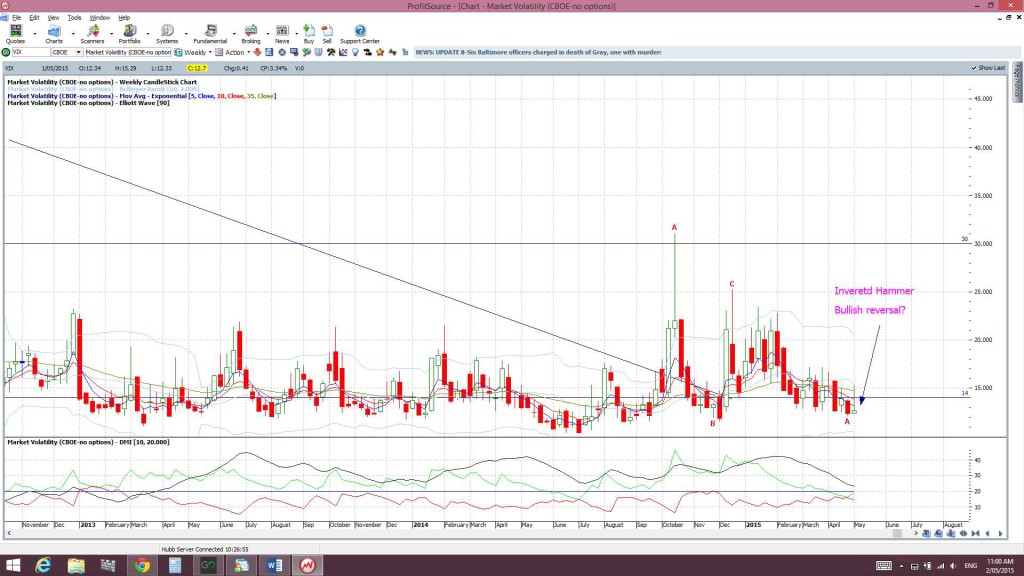
VIX: the ‘Fear’ index has printed a potential bullish-reversal candle and this may bode poorly for stocks.
There is high impact Chinese CPI data after the markets close next Friday so watch for any significant shift and impact on FX pairs at market open the following week.
Events in the Ukraine and the Middle East, as well as with Greek Debt talks, continue to have the potential to undermine any developing ‘risk’ appetite and need to be monitored.
Stocks and broader market sentiment:
The major US stock indices had a bearish week but I do think it is noteworthy that the S&P500 closed the week above 2,100, the DJIA above 18,000 and the NASDAQ above 5,000 support. This being the first weekly close for May could be seen, by some, as stocks giving a thumbs down to the ‘Sell in May and Go Away’ brigade. However, there is a warning technical pattern on both the S&P500 daily chart and VIX weekly chart to take notice of. Next week might prove to be more telling!
Thus, with all of this, I continue to watch out for further clues as to any new momentum move, long or short though! In particular I’m looking out for:
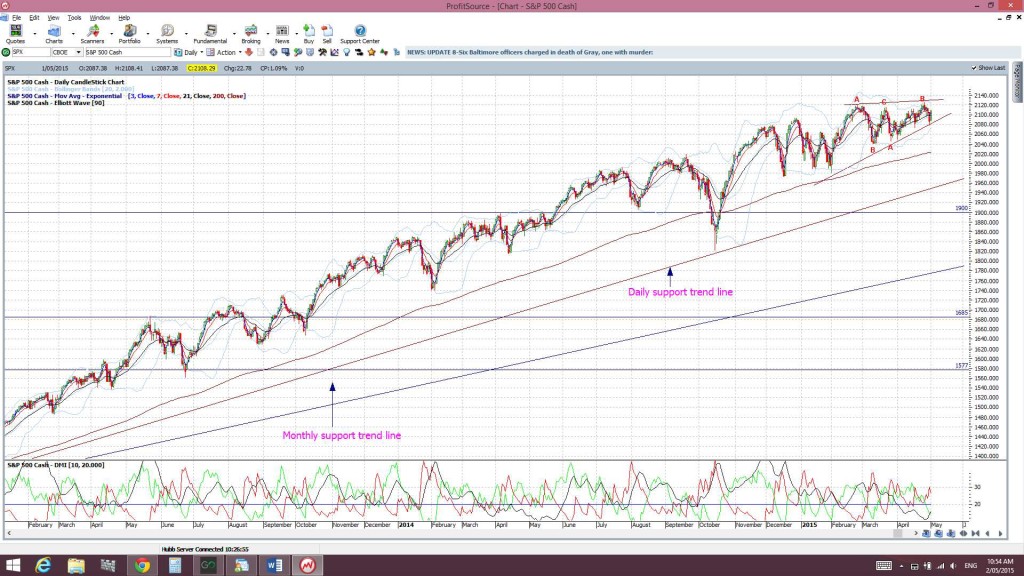
S&P500 daily chart: The index is still trading above the psychological 2,100 level and above daily trend line support. I do note that the bullish triangle breakout got little traction and there is a possible bearish ascending wedge. So, I’ll be watching these trend lines:
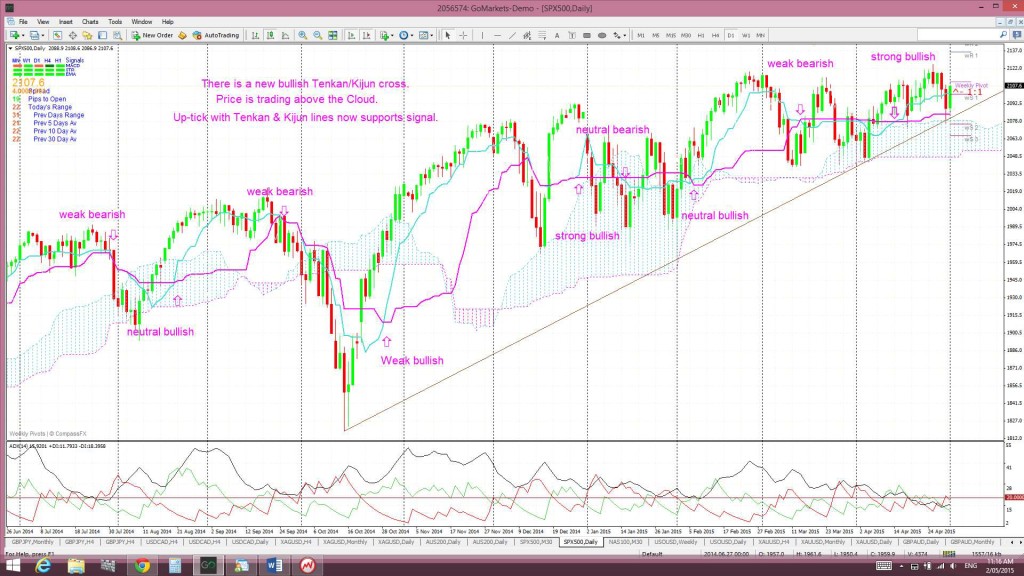
Ichimoku S&P500 chart: a clear cross of the blue Tenkan-sen line below the pink Kijun-sen line. There has been a recent bullish Tenkan/Kijun cross here and this evolved above the Cloud and so is deemed a ‘STRONG’ signal. The latest up-tick with the Tenkan/Kijun lines has now endorsed this bullish signal. Note the bounce up off the Cloud on FRiday:
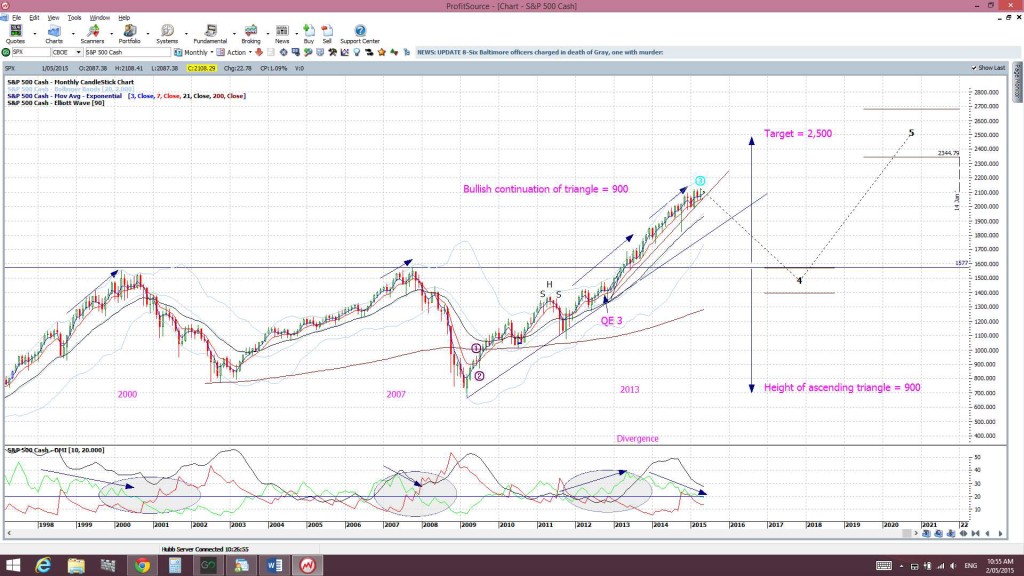
S&P500 monthly chart: a break of the monthly support trend line. The monthly trend line remains intact. A break of this support level would suggest to me of a more severe pull back or correction.
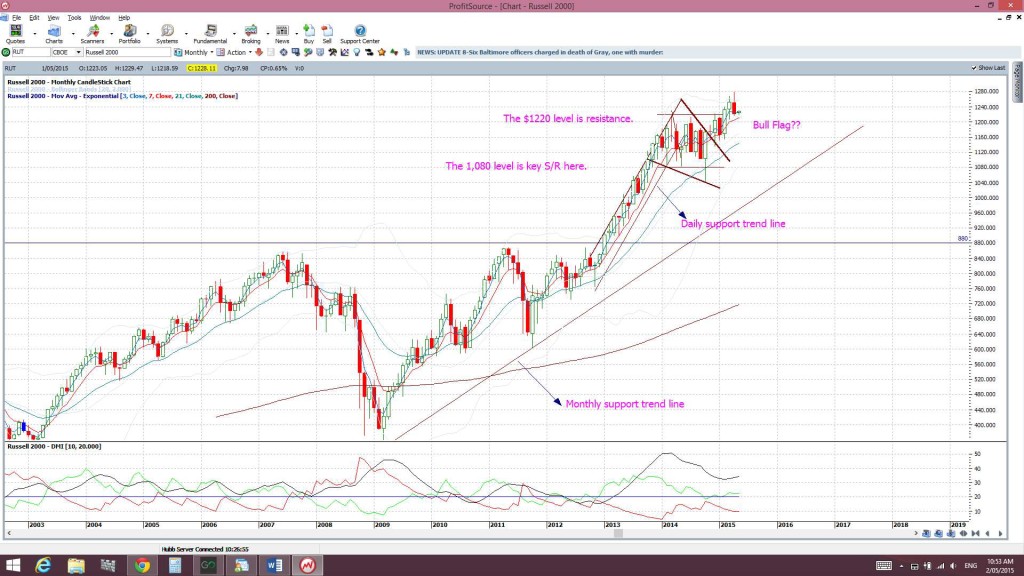
Russell 2000 Index: this small caps index is considered a US market ‘bellwether’. This is still trading above the key 1,220 level although it printed a bearish, almost engulfing, monthly candle. A close and hold back below 1,220 would be another warning bell:
VIX Index: The ‘Fear’ index is still below the 14 level BUT has printed a potentially bullish-reversal ‘Inverted Hammer’ candle. This will be worth watching and it may, at a minimum, point to some increased volatility with stocks!
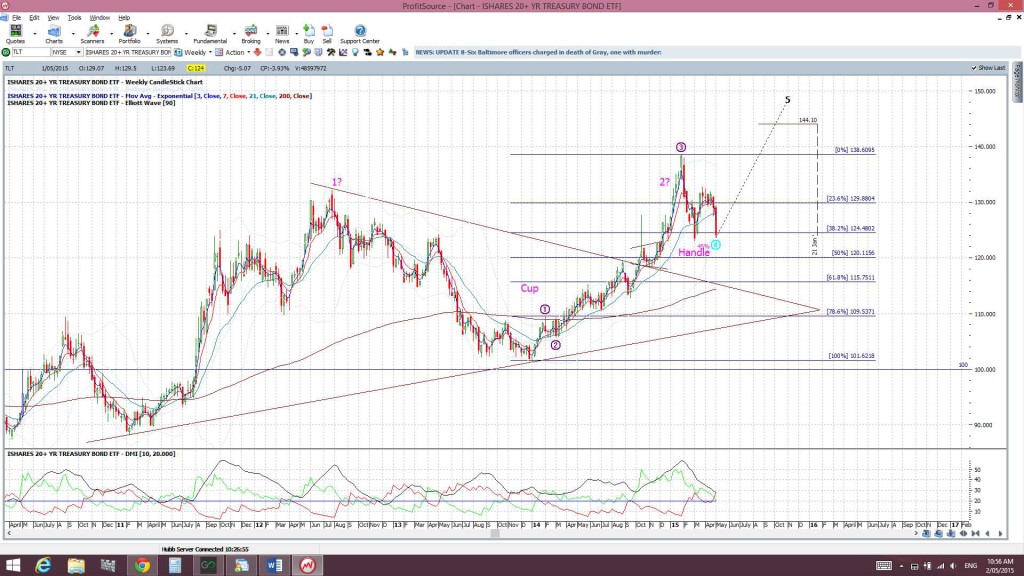
Bonds: The bond ETF has had a bearish week despite the weaker US$. Treasury yields were higher with optimism about a US rate hike and thus Bonds, which trade inversely to Yields, traded lower.
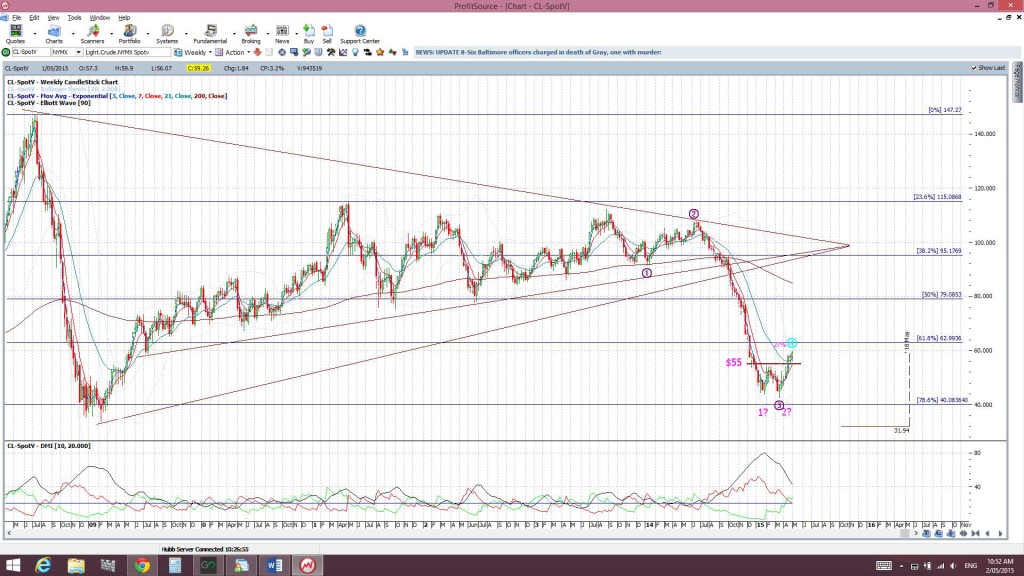
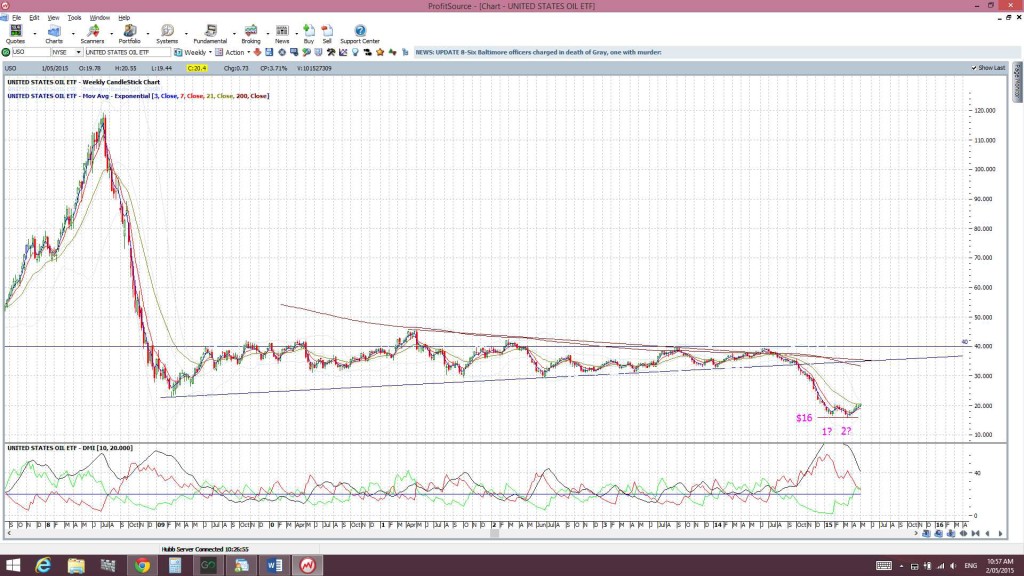
Oil: Oil had another bullish week after a recent bullish breakout from a ‘Double Bottom’. I’m still on the lookout for a test of the $55 ‘neck line’ breakout level before possible continuation but it is consolidating under the $60 level at the moment. USO is holding above $16 and still forming a bullish ‘Double Bottom’ with $20 as the ‘neck line here. The ETF has finally made weekly close above this $20 breakout region!
Trading Calendar Items to watch out for:
- Mon 4th: JPY, GBP Bank Holiday. AUD Building Approvals. CNY HSBC Final Manufacturing PMI. G7 Meetings.
- Tue 2nd: JPY Bank Holiday. AUD Trade Balance, Cash Rate & RBA Statement. EUR Spanish Unemployment change. GBP Construction PMI. CAD Trade Balance. USD Trade Balance & ISM Non-Manufacturing PMI.
- Wed 3rd: JPY Bank Holiday. G8 Meetings. NZD GDT Price Index & Employment data. AUD Retail Sales. GBP Services PMI. USD ADP NFP. CAD Ivey PMI.
- Thurs 4th: AUD Unemployment Rate. GBP UK Elections. CAD Building Permits. USD Unemployment Claims.
- Fri 5th: AUD RBA Monetary Policy Statement. EUR French Bank Holiday. CNY Trade Balance. CAD Employment Data. USD NFP.
- Sat 6th: CNY CPI.
Forex:
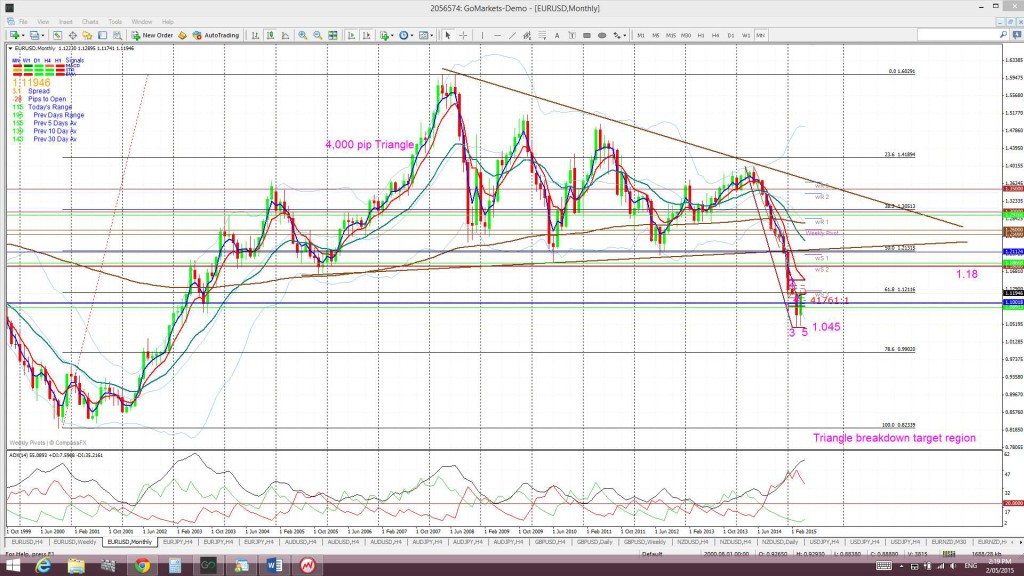
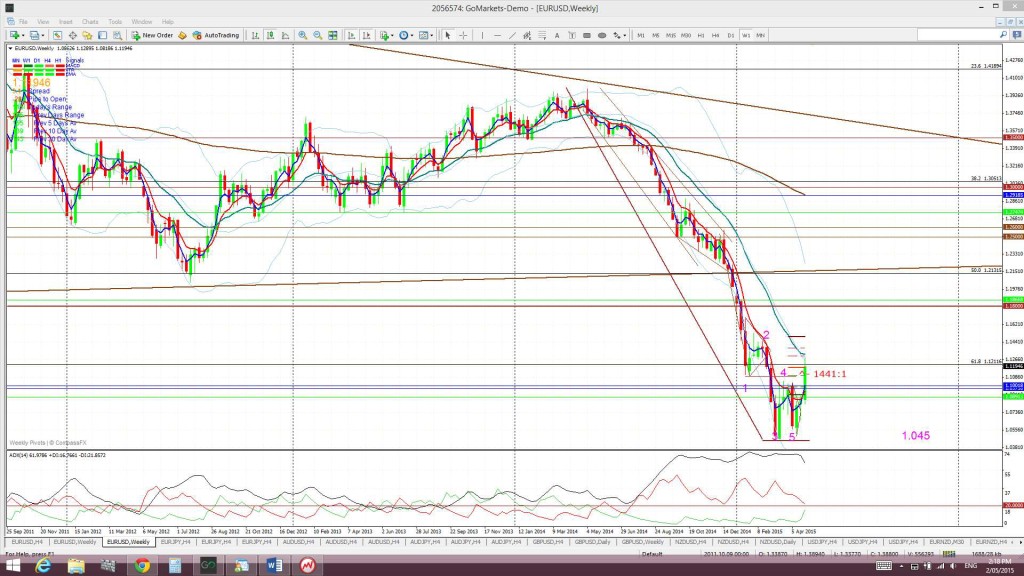
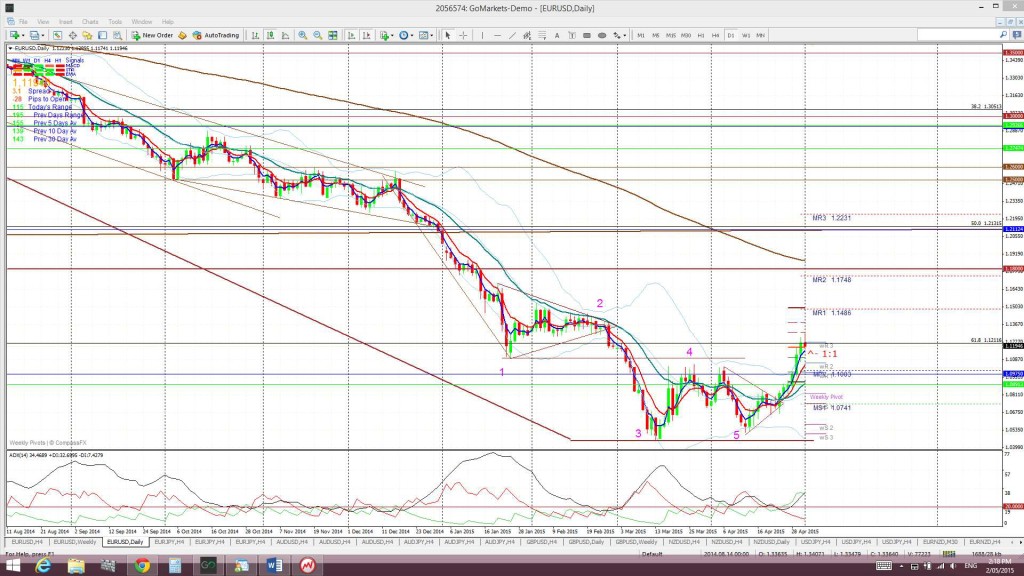
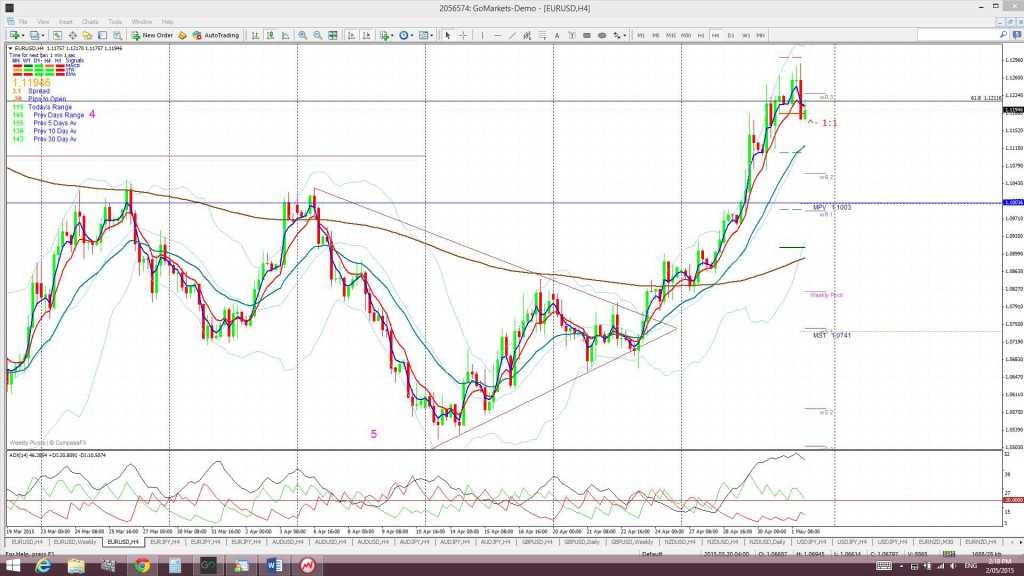
E/U: The E/U continued higher last week after the previous week’s triangle breakout. It rallied up to the key 1.12 level which is the 61.8% fib of the 2000-2008 swing high move. Whilst the E/U closed above this key level for the month of April it didn’t manage to close above this level for the first week of May. The monthly candle has printed a bullish-reversal pattern though and so it remains to see whether there will be gains to follow. Some traders will be looking to sell this pair given the failure to make a weekly close above the 61.8% fib and 1.12 levels:
The daily chart of the E/U is still conforming to the Elliott Wave Bear Market Truncation pattern so keep watching for any continued move higher:
A hold above 1.12 would suggest continuation and the 1.18 S/R level would be an obvious target. However, a failure to hold above 1.12 could help to form a weekly-chart Bear Flag pattern with a base near 1.045.
Descending triangle on the monthly chart: Despite this recent bullish activity there is still an overall bearish pattern in play on the E/U monthly chart: a 4,000 pip bearish descending triangle breakdown on the monthly chart. The descending triangle pattern is a bearish continuation pattern and has a base at around the 1.18 level. The height of this triangle is about 4,000 pips. Technical theory would suggest that any bearish breakdown of this triangle below 1.18 might see a similar move. It is worth noting that this would bring the E/U down near 0.80 and to levels not seen since 2000/2001! The monthly chart (above) shows how critical this 1.18 level is for the E/U.
Price is now trading above the Ichimoku Cloud on the 4hr and daily charts but below the Cloud on the weekly and monthly charts.
The weekly candle closed as a large bullish candle although below 1.12. The April monthly candle closed as a bullish candle in a bullish-reversal ‘Railway Track’ formation:
To summarise the various technical signals here then:
Bullish:
- Conforming to Bear Market Truncation pattern.
- Bullish-reversal ‘Railway Track’ monthly candle printed for April.
- Monthly candle close above 1.12.
- Monthly close above the 61.8% fib.
- Large bullish weekly candle printed.
Bearish:
- Weekly close below the 61.8% fib.
- Weekly close below 1.12.
There is only one scheduled piece of high impact EUR news next week and this is Spanish Employment data. However, the Greek-debt situation continues and the UK election might also impact the EUR by way of EUR/GBP flows. Also, there is a lot of US data that will impact here too: US Trade Balance, ISM Non-Manufacturing data, a Fed-Chair Janet Yellen speech, weekly Unemployment Claims and NFP.
- I’m watching for any new TC signal and the 1.12 and 1.045 levels.
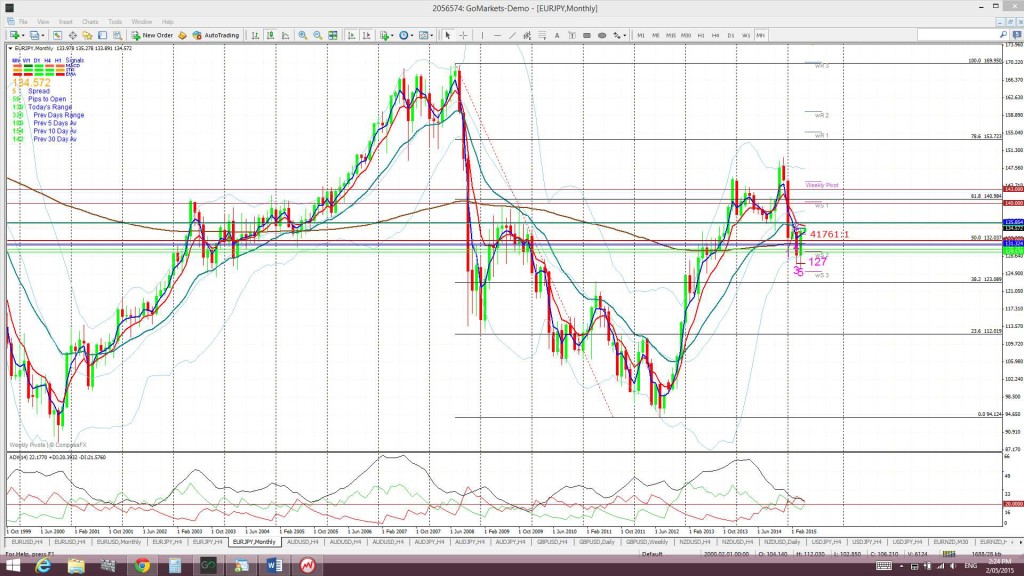
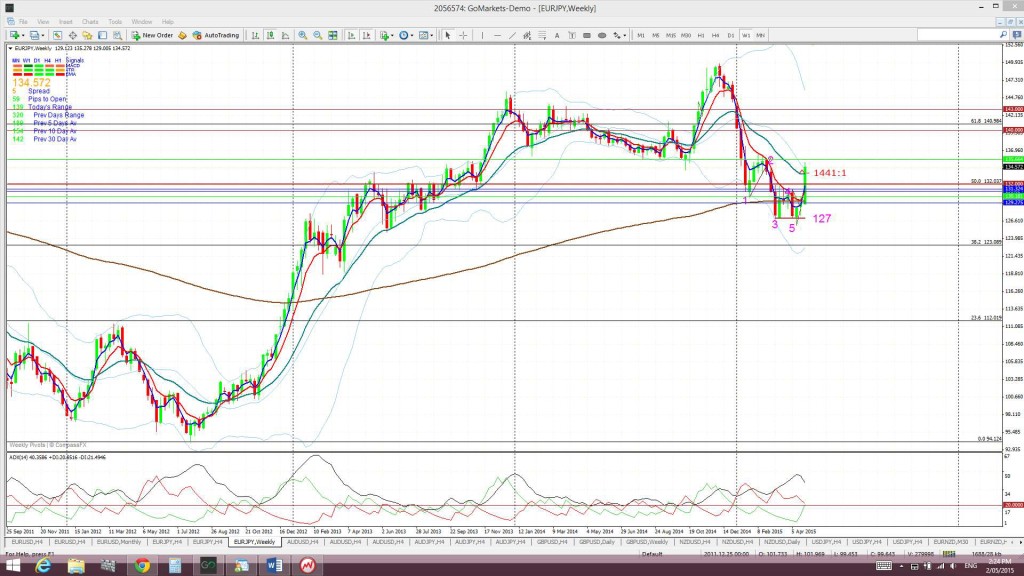
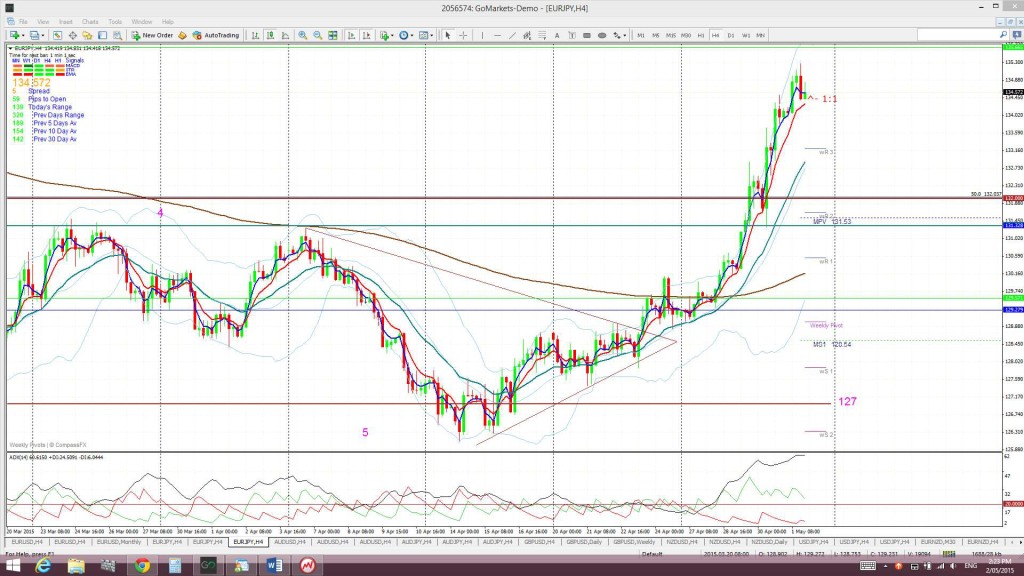
E/J: Like the E/U, the E/J also rallied after the previous week’s triangle breakout. I had noted mid-week to watch out for reaction at the 132 / 50% fib level but price raced on right up past it!
The E/J is also still conforming to the Elliott Wave Bear Market Truncation pattern so keep watching for any continued bounce.
Price is now trading above the Cloud on the 4hr, daily and monthly charts but below the Cloud on the weekly chart.
The weekly candle closed as a large bullish candle. The April monthly candle closed as a bullish candle in a bullish-reversal ‘Railway Track’ formation AND with a bounce up off support from the top of the monthly Cloud.
- I’m watching for any new TC signal on this pair.
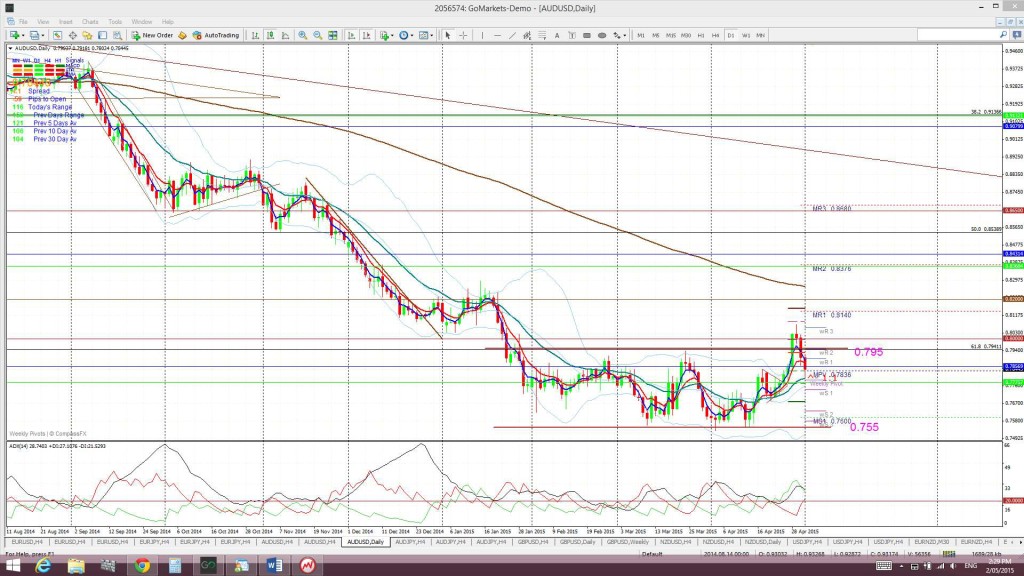
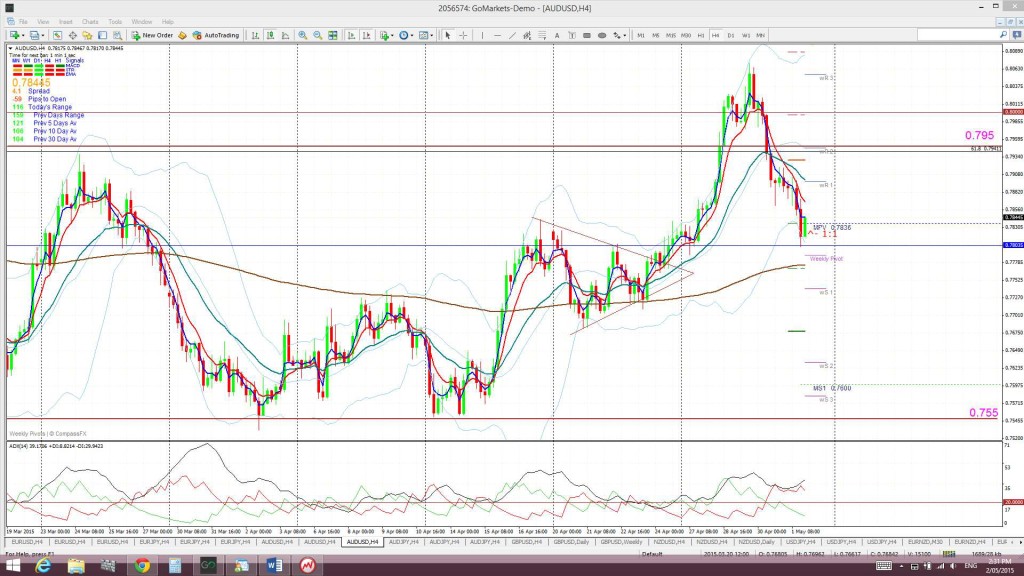
A/U: The A/U, like the E/U and E/J, rallied following the previous week’s triangle breakout and gave a 270+ pip move. It then seemed to remember that there is an RBA Interest Rate announcement next week and duly pulled back. Thus, price still remains channel bound between 0.755 and 0.795.
Whilst the dovish bias of the RBA is well known this pair might receive some support from any continued US$ weakness. As well, any accompanying bounce with commodities might also add support here. Thus, whilst many are expecting an RBA rate cut next week the SHORT trade here may not be as clear cut as expected. A rate cut on Tuesday might set up for a good 250+ pip scalp trade SHORT down to 0.755 but this level might act as decent support. However, any close and hold below the 0.755 trading channel would be bearish and then support a ‘Bear Flag’ move lower. The length of the ‘Flag Pole’ of the recent swing low move is about 1,700 pips and so any Bear Flag breakout would be worth joining.
Price is trading above the Cloud on the 4hr chart, in the middle of the Cloud on the daily but below the Cloud on the weekly and monthly charts.
The weekly candle closed as a small bullish candle with a long upper shadow. The April monthly candle closed as a bullish engulfing candle.
There is a lot of news to impact the AUD/USD this week: AUD Building Approvals, CNY HSBC Final Manufacturing PMI, AUD Trade Balance, RBA Interest Rates, AUD Employment data, RBA Monetary Policy Statement and CNY Trade Balance and CPI PLUS all of the USD-sensitive data.
- I’m watching for any new TC signal on this pair.
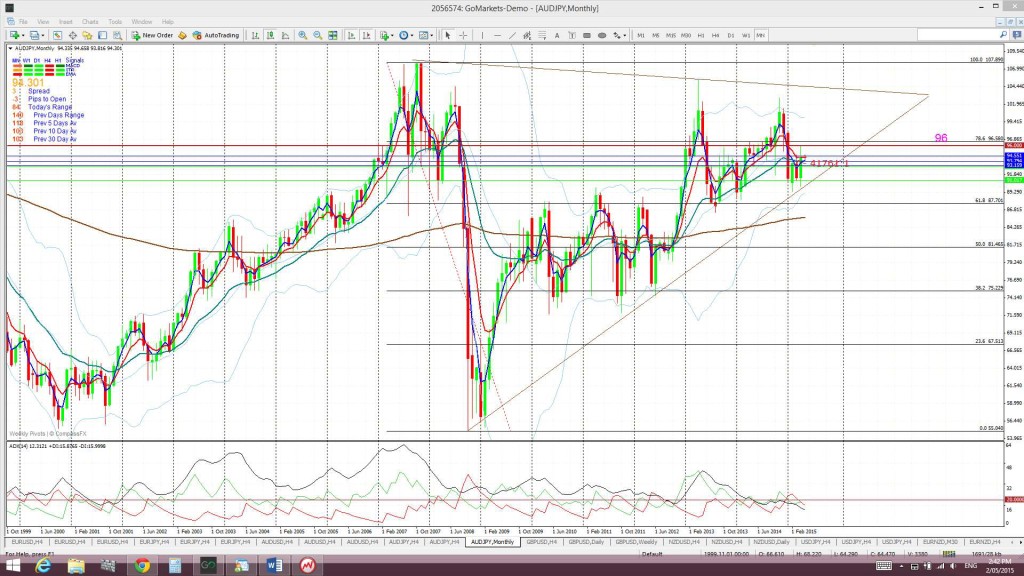
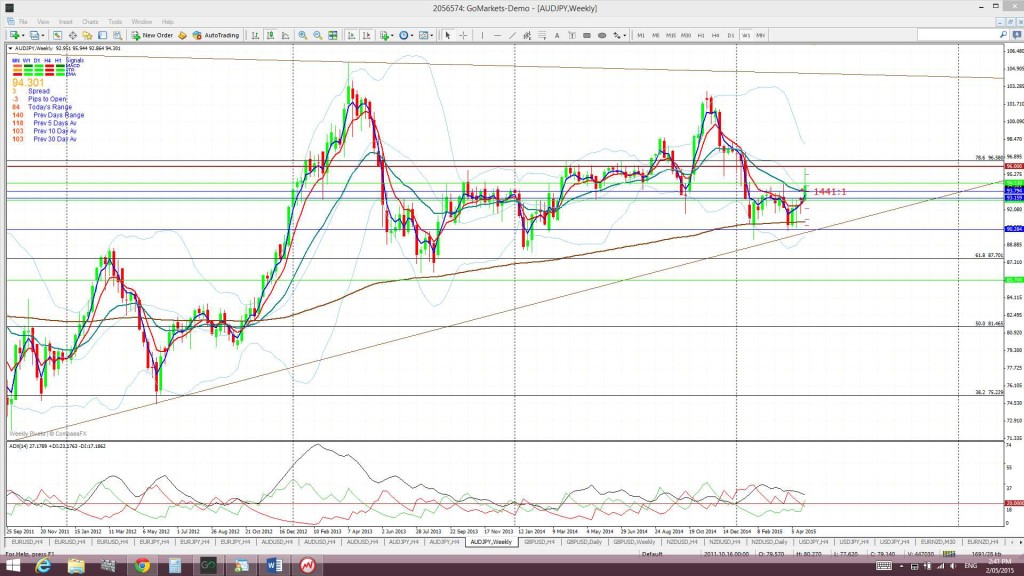
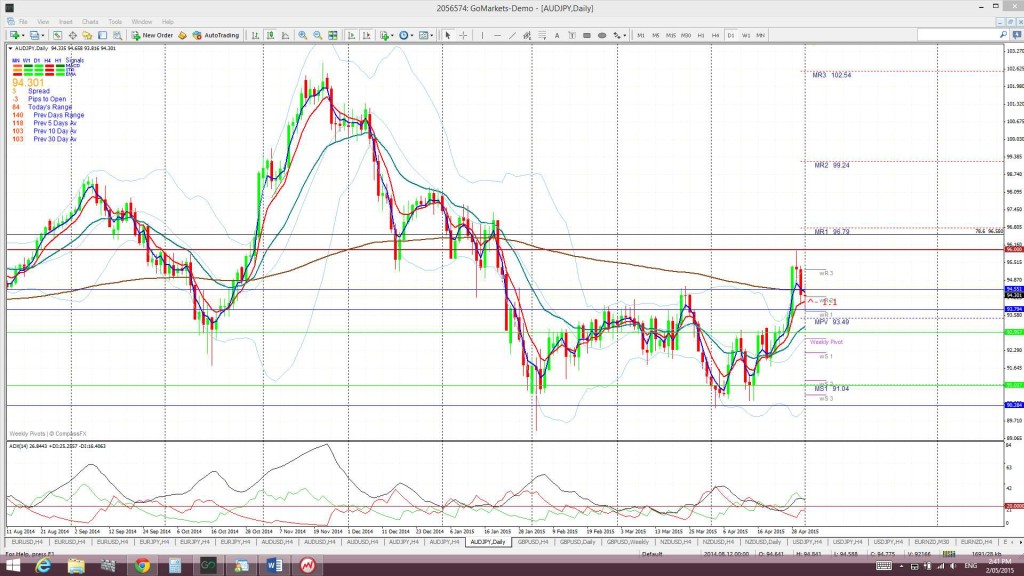
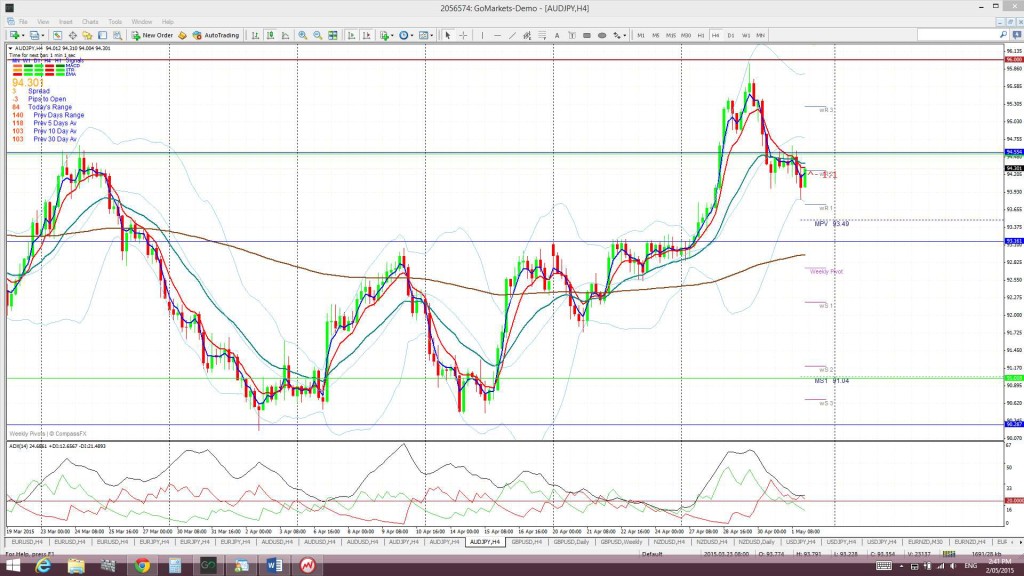
A/J: As with the A/U, the A/J also rallied last week and made it up to the previous S/R level of 96. The A/J closed the week below 96 but this will be the level to watch in coming sessions
The weekly chart continues to show price action holding above the weekly 200 EMA and the monthly chart shows the A/J conforming to a triangle pattern.
Price is trading above the Cloud on the 4hr, daily and monthly chart but in the Cloud on the weekly chart.
The weekly candle closed as bullish, almost engulfing, candle as did the April monthly candle.
Risk events for this pair are as for the A/U but it is worth remembering the Bank Holiday’s in Japan for Mon-Wed.
- I’m watching for any new TC signal on this pair and the 96 level.
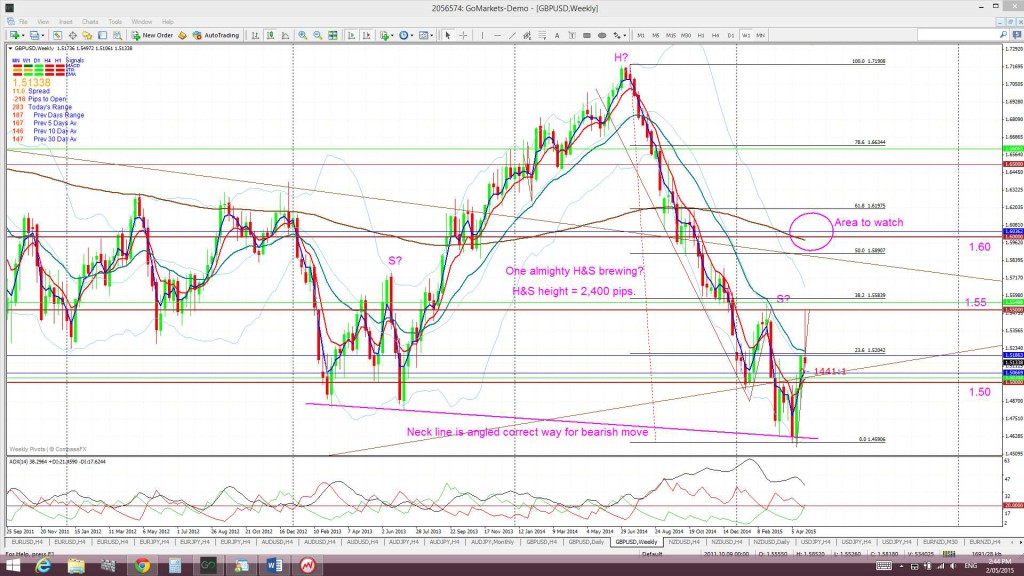
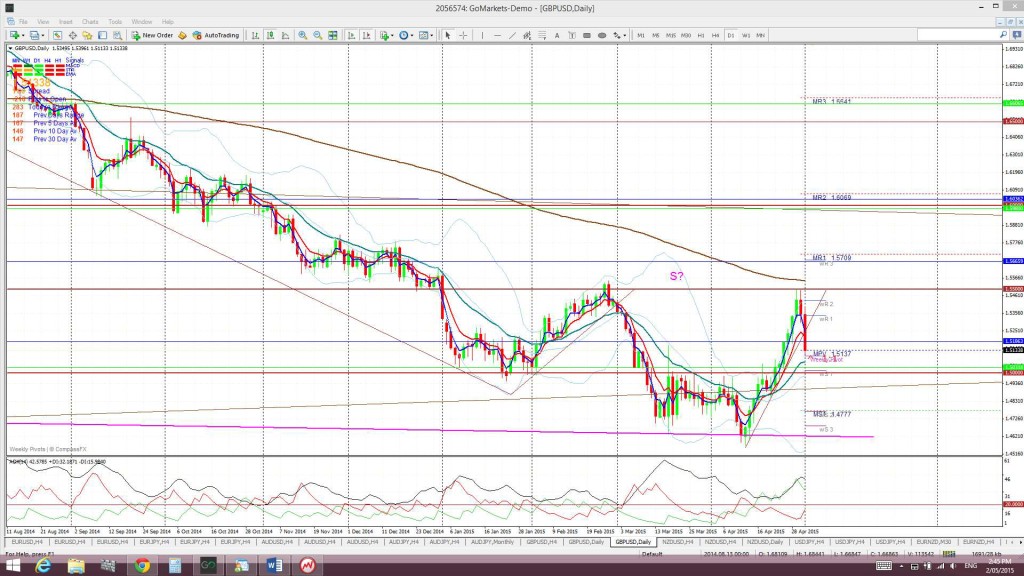
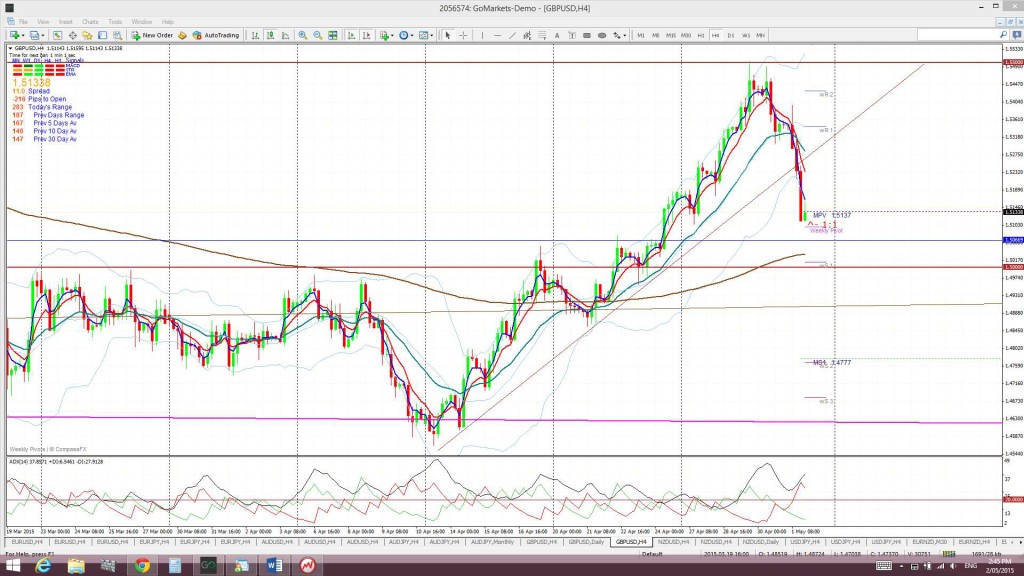
G/U: The Cable rallied up to the 1.55 level last week. It looked like it was going to park just under this resistance for the week whilst waiting for next week’s UK elections but weaker than expected Manufacturing data on Friday sent price tumbling and down through a recent support trend line. Price came to rest for the w/e just above the weekly pivot.
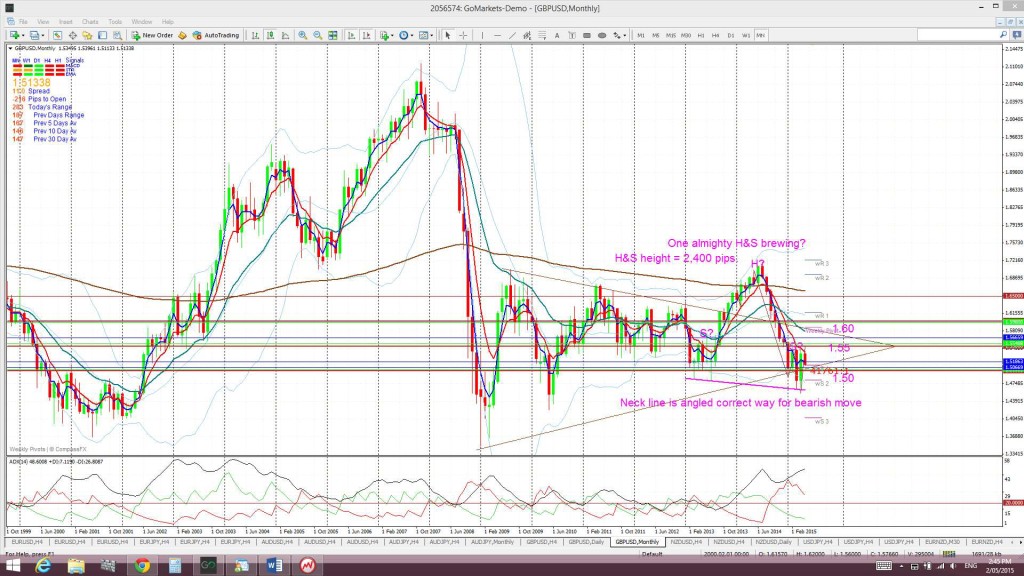
Weekly chart H&S: There is a possible bearish H&S pattern still forming on the weekly chart and the failure to continue above 1.55 has added support to this pattern. The height of the H&S is about 2,400 pips and suggests a similar move lower with any break and hold below the ‘neck line’. Recall that the GBP/USD printed a monthly close in March below 1.50, the first since June 2010. This bearish development supports the H&S pattern BUT we need to see a close and hold below the ‘neck line’ to confirm any such bearish breakdown.
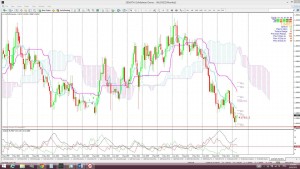
Price is now trading above the Cloud on the 4hr and daily charts but below on the weekly and monthly charts.
The weekly candle closed as a bearish-reversal ‘Shooting Star’ candle. The April monthly candle, however, closed as a bullish candle and, whilst technically it formed an indecision-style ‘Inside’ candle, it too has a bit of a bullish-reversal ‘Railway Track’ look to it.
Cable traders will be closely watching the UK General Election this coming Thursday May 7th. The uncertainty surrounding the result of this election will most likely keep pressure on the Cable until then. As previously mentioned, I would not be surprised to see a relief rally if the Conservative retain government.
- I’m watching for any new TC signal on this pair and the 1.55 level.
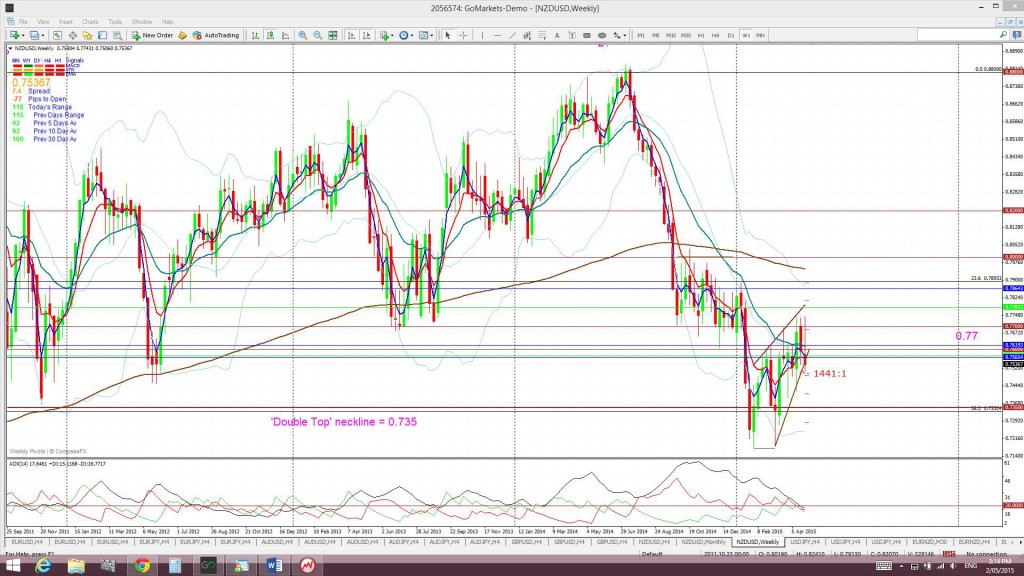
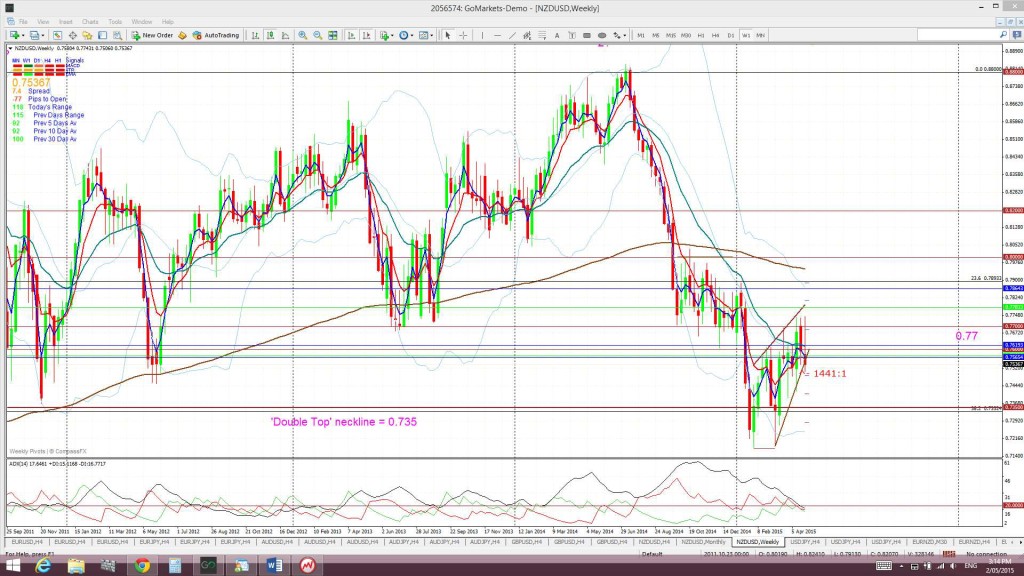
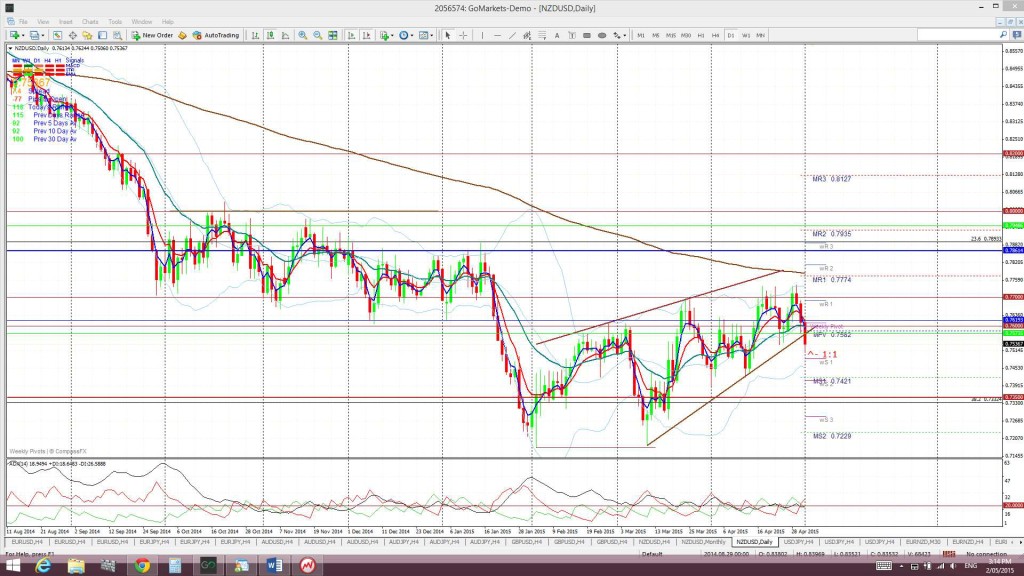
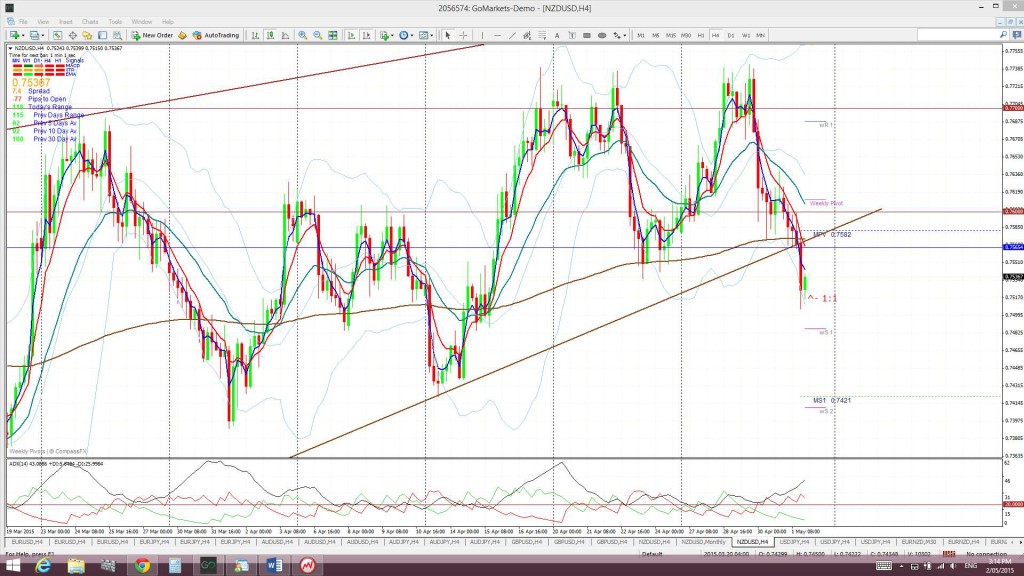
Kiwi: NZD/USD: The Kiwi chopped up to the 0.77 level again last week but, despite keeping interest rates on hold, more jawboning from the RBNZ in their Rate Statement resulted in price reversing from this peak and closing below 0.76. Further weakness on Friday resulted in the Kiwi breaking down below the daily and 4hr chart bearish ascending wedge pattern. Continued weakness would see this pair most likely heading to test 0.735…. yet again.
AUD/NZD tying to tell us something? It is at this point that I want to draw attention to the AUD/NZD monthly chart (chart below). The monthly AUD/NZD candle closed for April as a bullish engulfing candle and above parity which points to a possible reversal here. This would sit logically for me, especially if the US$ continues to weaken. Both the AUD and NZD are commodity currencies and would benefit from any continued US$ weakness. However, Australia generates both ‘hard’ and ‘soft’ commodities whereas New Zealand produces predominately ‘soft’ commodities. Thus, US$ weakness AND any recovery with commodity pricing stands to add more support to the AUD relative to the NZD:
AUD/NZD monthly:
‘Double Top’ breakdown on Monthly chart? The monthly NZD/USD chart still reveals a possible ‘Double Top’ pattern with a neck line at 0.735 in the making. The monthly candle close below this level for January suggested a possible 2,000 pip bearish follow through move as this is the height of the ‘Double Top’ BUT there has not been a hold below this key level JUST YET.
Price is now trading below the Ichimoku Cloud on the 4hr chart, above on the daily chart, below on the weekly chart but in the middle of the Cloud on the monthly chart.
The weekly candle closed as a bearish coloured Doji candle although the April monthly candle closed as a bullish, almost, ‘engulfing’ candle.
The mains risk events for the Kiwi this week include CNY HSBC Final Manufacturing PMI, NZ Employment data, CNY Trade Balance and CPI data and all of the data impacting the US$.
- I’m watching for any new TC signal on this pair and the 0.735 level.
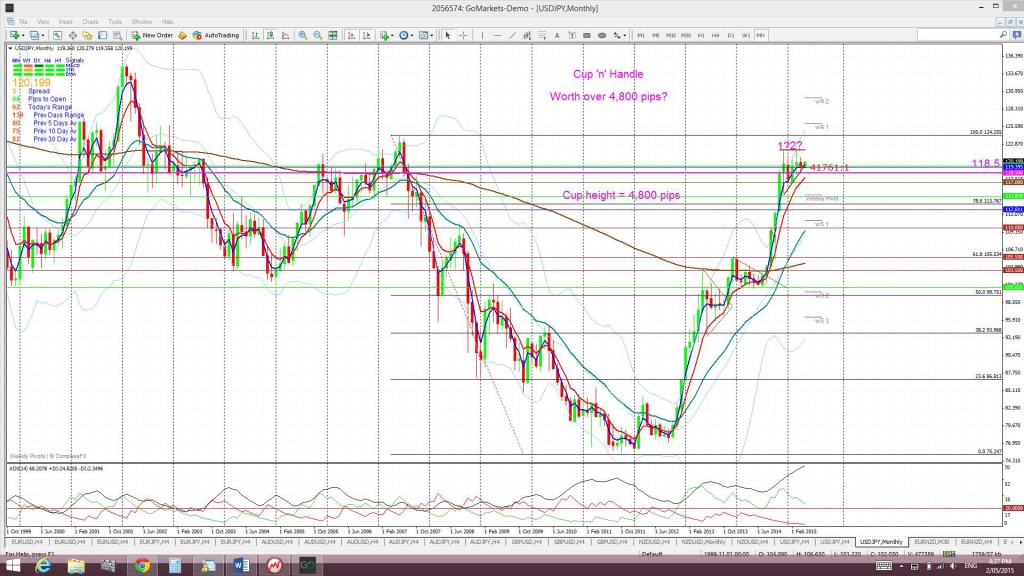
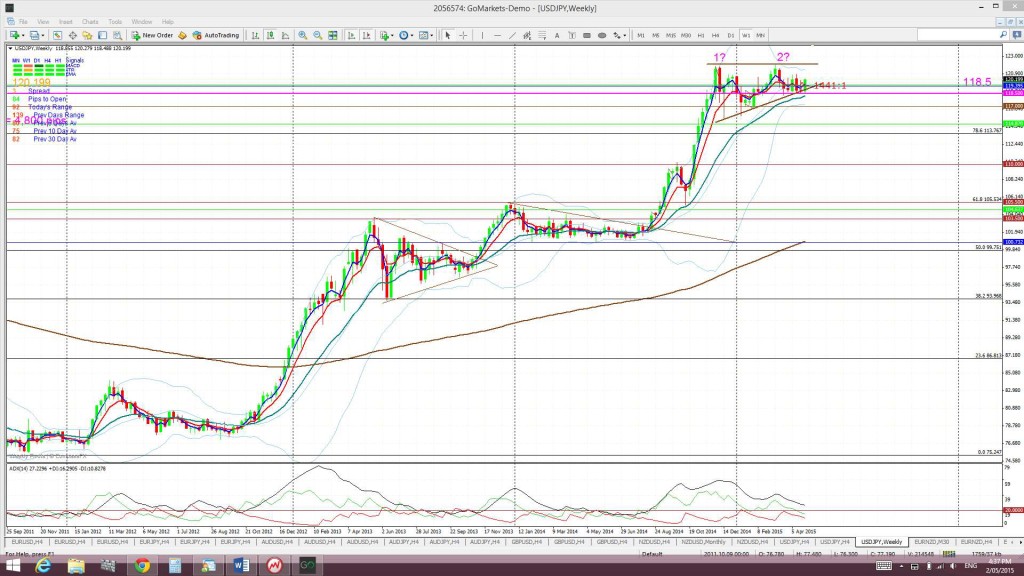
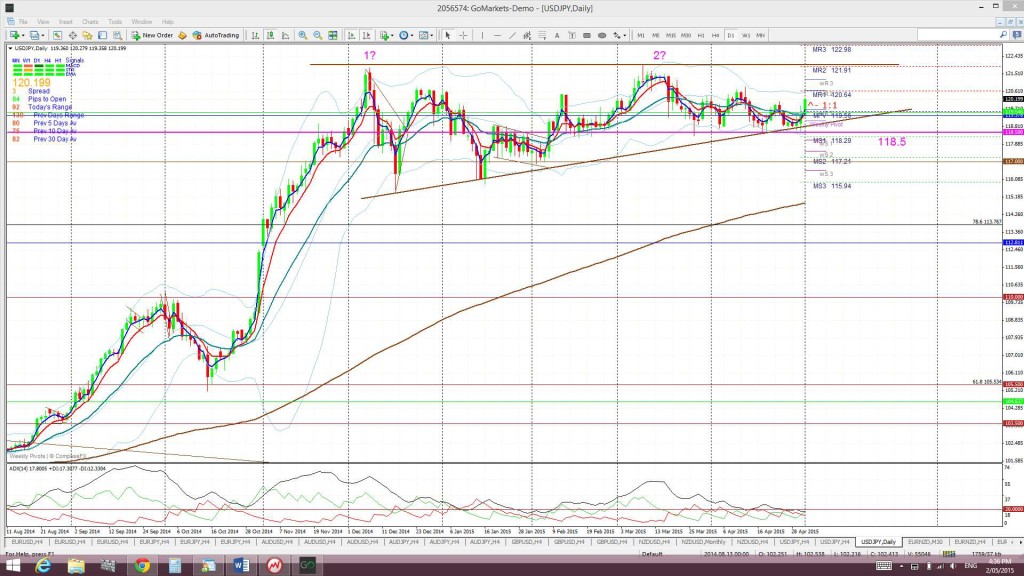
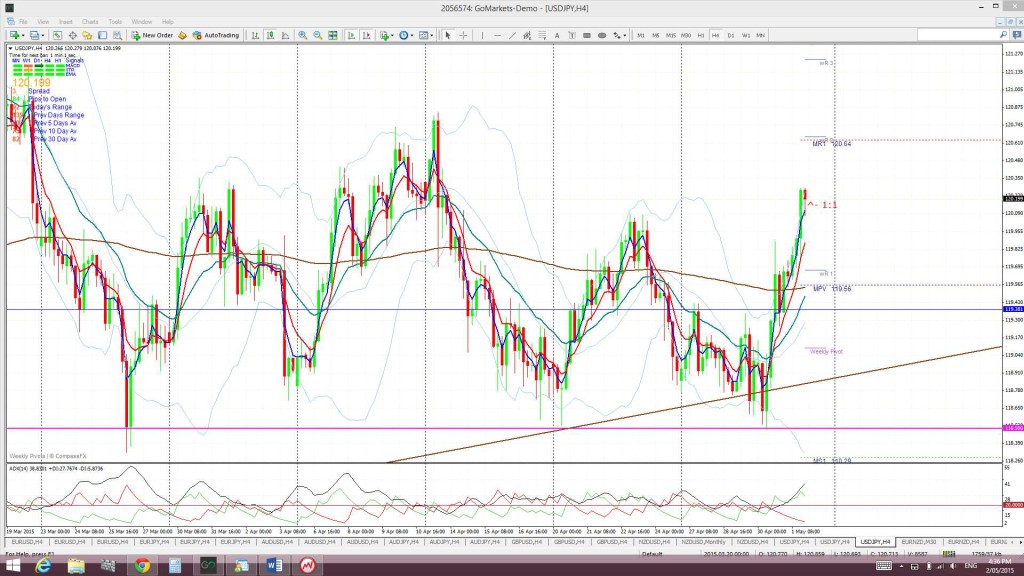
The Yen: U/J: The U/J chopped down to test the 118.5 level again last week before bouncing higher. The daily/weekly charts still show a bullish ascending triangle pattern developing and I continue to view this choppy triangle action as helping to form the ‘Handle’ of a potential Cup ‘n’ Handle on the monthly chart.
Price is now trading above the Cloud on the 4hr, weekly and monthly charts and just above the Cloud on the daily chart. November 2013 was the first monthly candle close above the Ichimoku Cloud since mid-2007 and the bullish hold above the monthly Cloud continues to be noteworthy.
The weekly candle closed as a small but bullish ‘engulfing’ candle. The April monthly candle closed as a small bearish, essentially, ‘engulfing’, candle.
Monthly Chart Bullish Cup’ n’ Handle pattern: There looks to be a new bullish Cup ‘n’ Handle forming up on the monthly chart. The theory behind these patterns is that the height of the ‘Cup’ pattern is equivalent to the expected bullish move from the ‘handle’ breakout. The height of the Cup for the U/J weekly chart is around 4,800 pips. The current sideways choppy action is helping to form the ‘Handle’ here.
- I’m watching for any new TC signal on this pair, the ‘Handle’ trend lines and the 118.5 level.
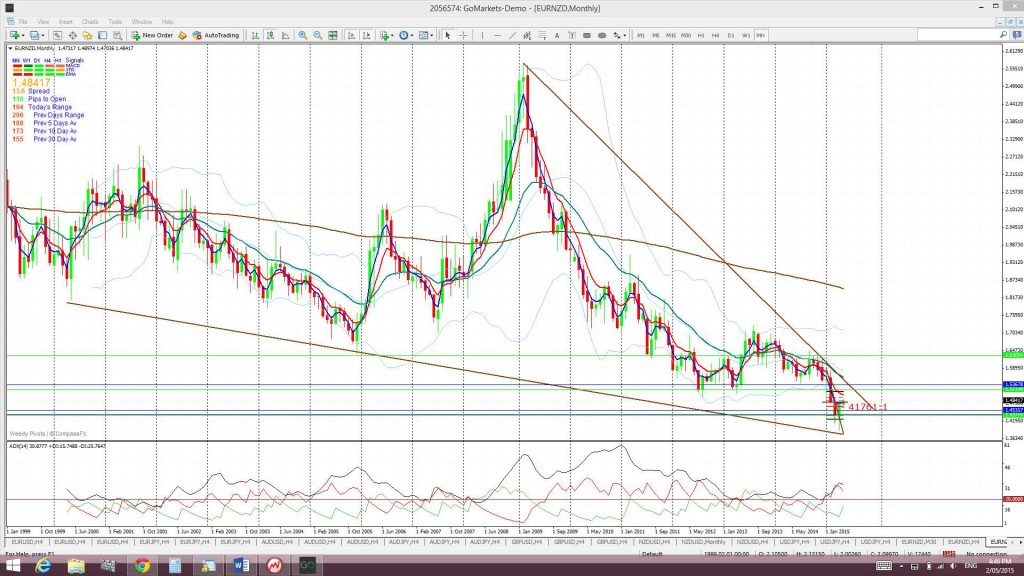
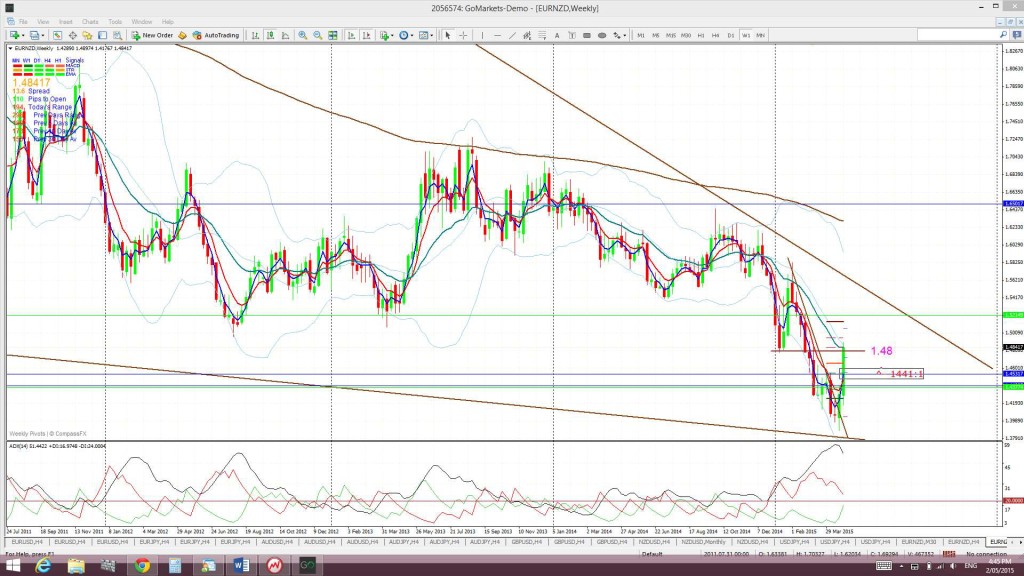
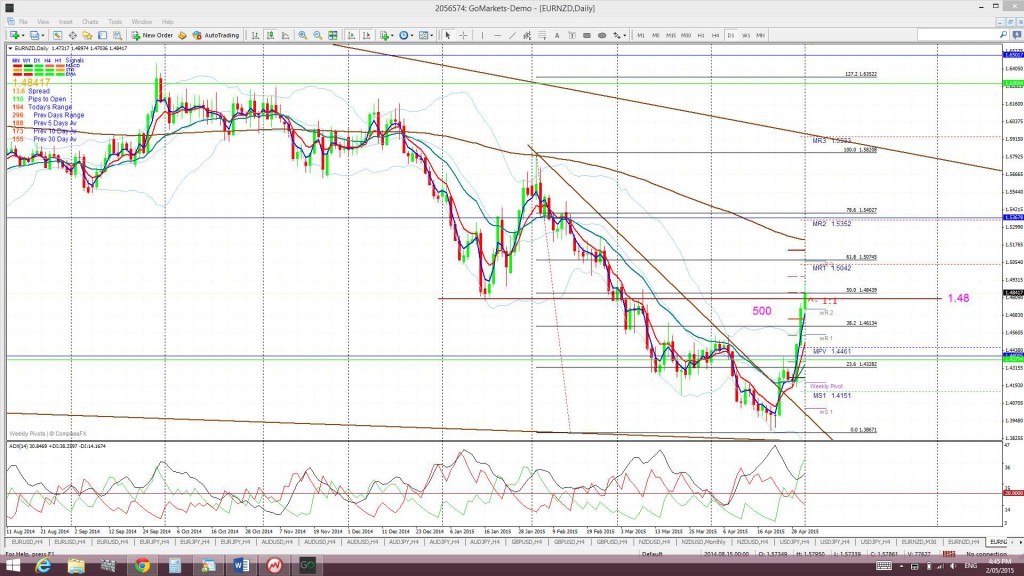
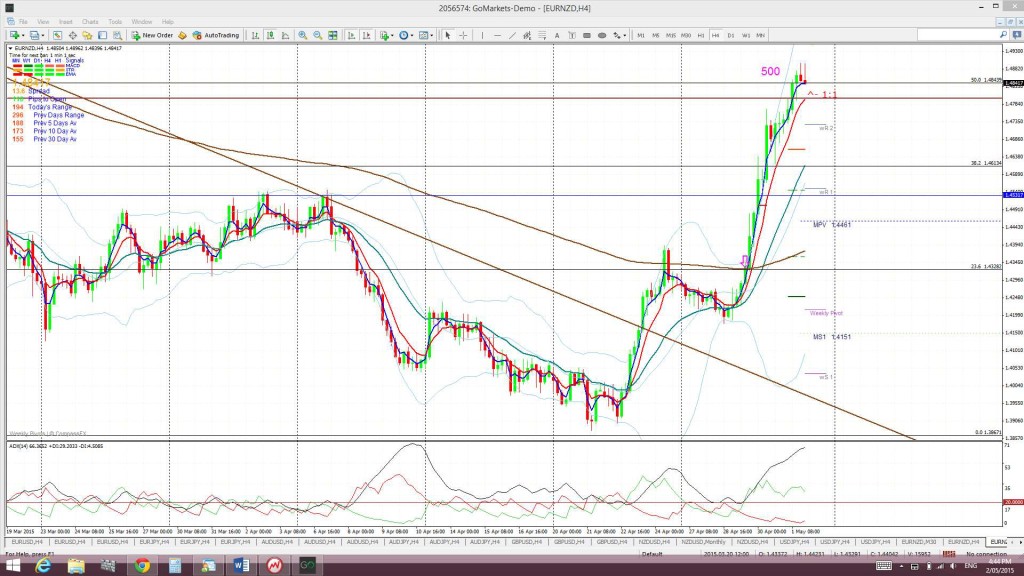
EUR/NZD: Price continued to rally after breaking out last week above a daily-chart bear trend line and back above the 4hr Cloud. There was a new TC signal during the week that came off an 11pm candle and so I missed it. More the pity as price continued on for over 500 pips up. Price also broke above a recent S/R level of 1.48.
Whilst this pair is clearly in a monthly chart downtrend I am conscious of the bullish descending pattern that is evolving and thus I am open to LONG trades here.
Price is now trading above the 4hr Cloud, in the daily Cloud but below the weekly and monthly Clouds. The top of the daily Cloud is near the whole number 1.50 level and the 61.8% retracement fib of the recent swing low move. Thus, any break above the daily Cloud, 1.50 and this fib level would be rather bullish and suggest continuation:
The weekly candle closed as a large bullish candle following on from last week’s bullish engulfing candle. Like the Cable, the April monthly candle closed as a bullish candle and, whilst technically also an ‘Inside’ candle, it too has a bullish-reversal ‘Railway Track’ look to it.
- There is an open TC signal here.
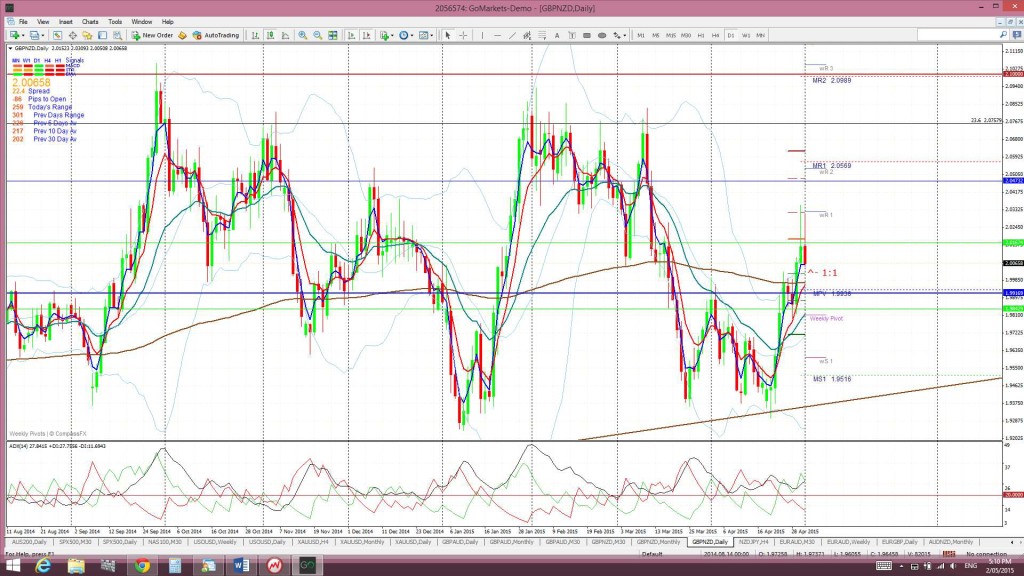
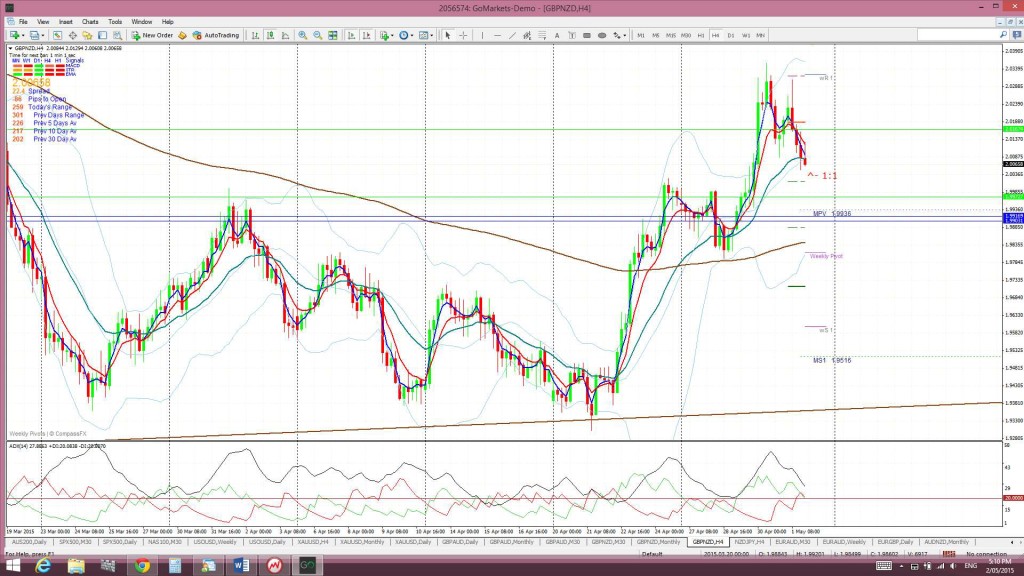
GBP/NZD: The GBP/NZD chopped a bit higher last week. I’ll be more interested in this pair possibly after the UK Election and if NZD weakness continues.
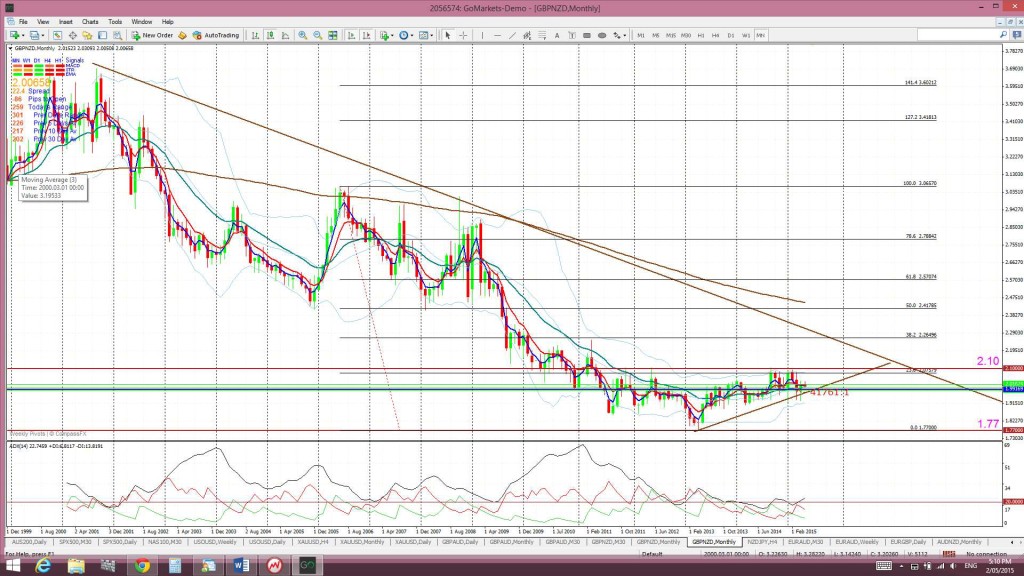
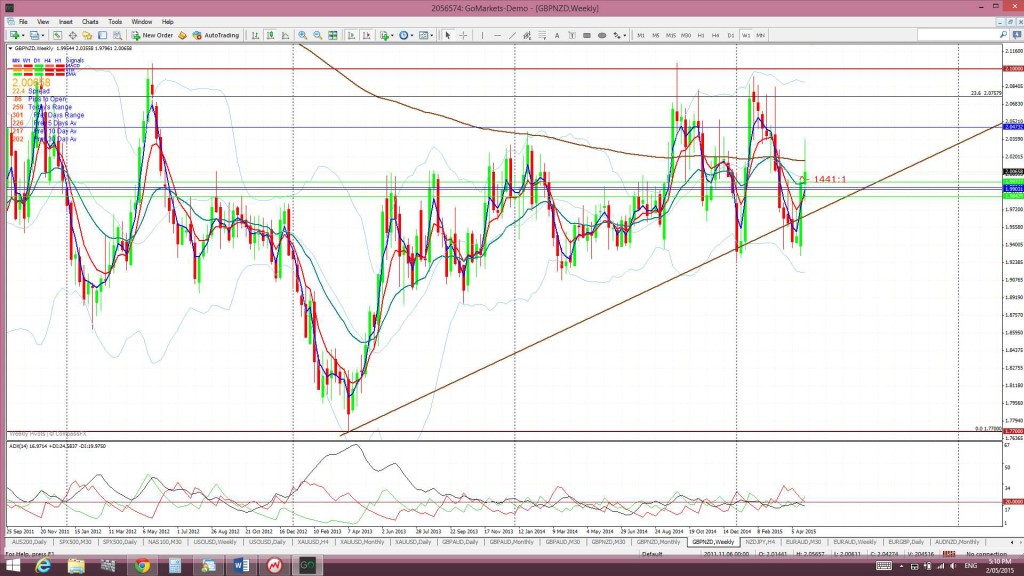
The monthly chart shows this pair in a down trend and trading under a bear trend line. However, price has bounced up off the 1.77 level and may be trying to carve out a recovery from this base. This chart also shows the 2.10 level as a clear-cut longer term S/R level and this is giving the monthly and weekly charts a bit of a bullish ascending triangle appearance.
The GBP/NZD is now trading above the Cloud on the 4hr chart, in the Cloud on the daily chart, just below the Cloud on the weekly chart and in the bottom of the Cloud on the monthly chart.
The weekly candle closed as bullish ‘Spinning Top’ candle. The April monthly candle closed as a bullish coloured ‘Inside’ candle. These candles reflect the high level of indecision with this pair at the moment.
- I’m watching for any new TC signal and the ascending triangle trend lines.
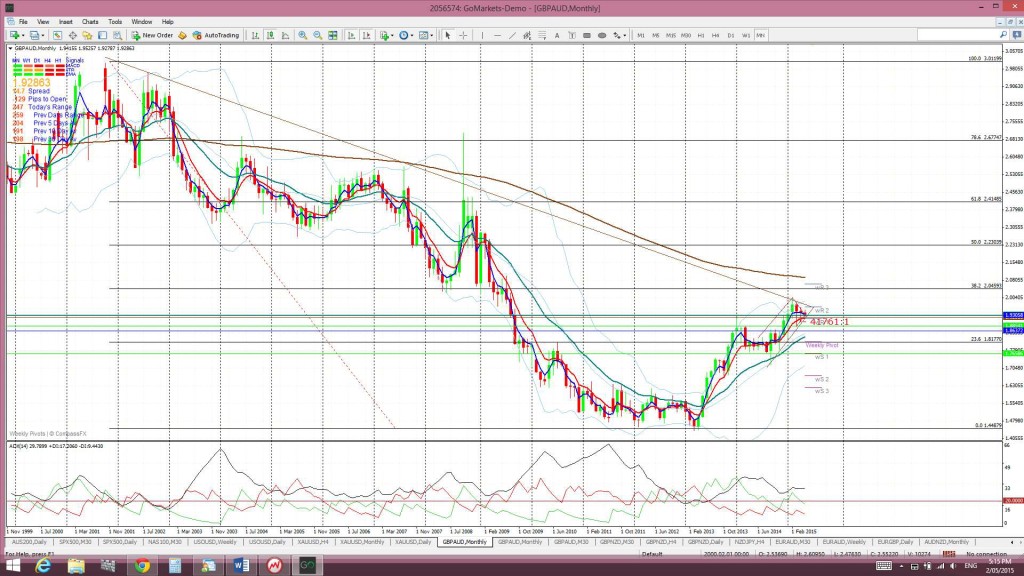
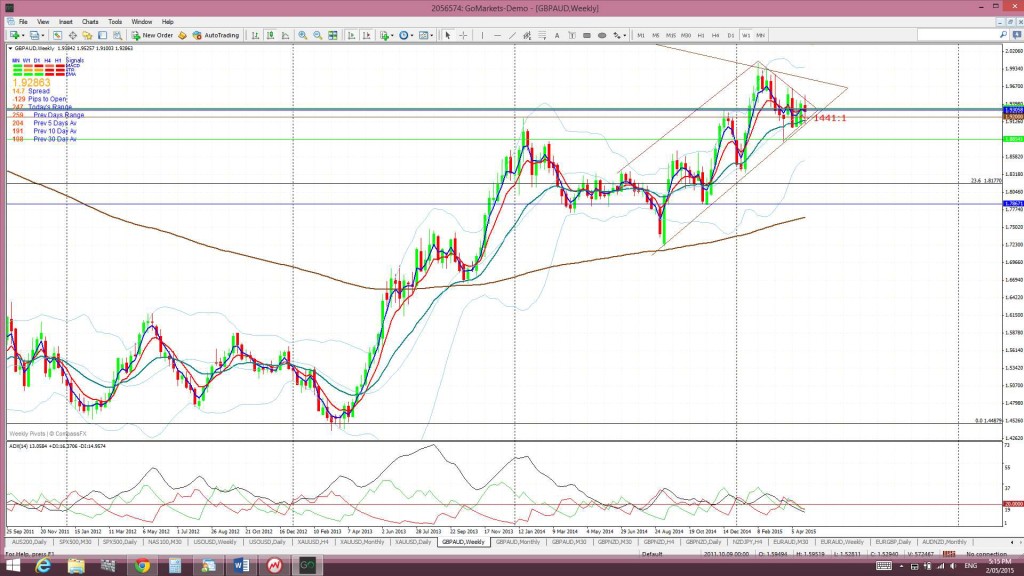
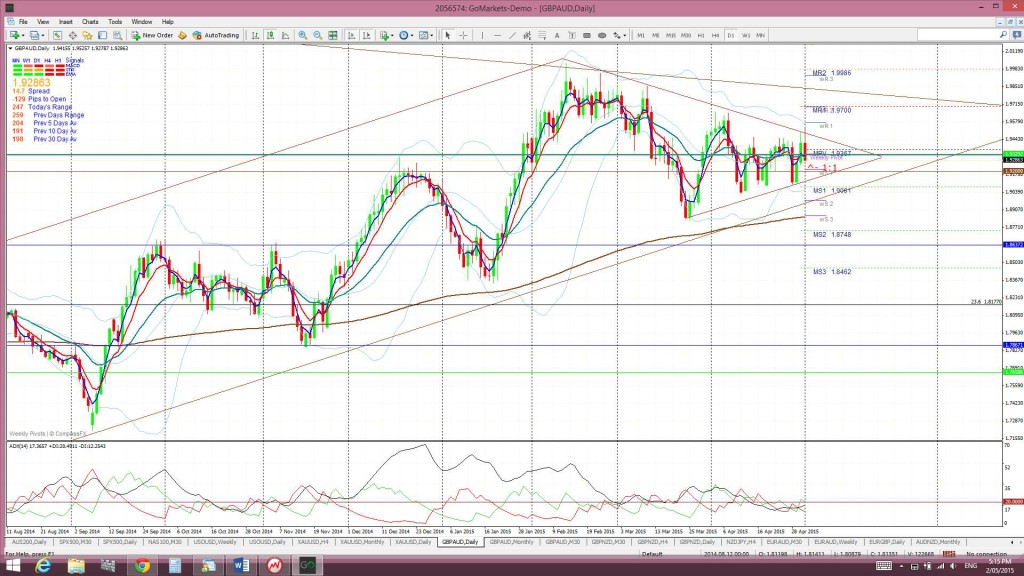
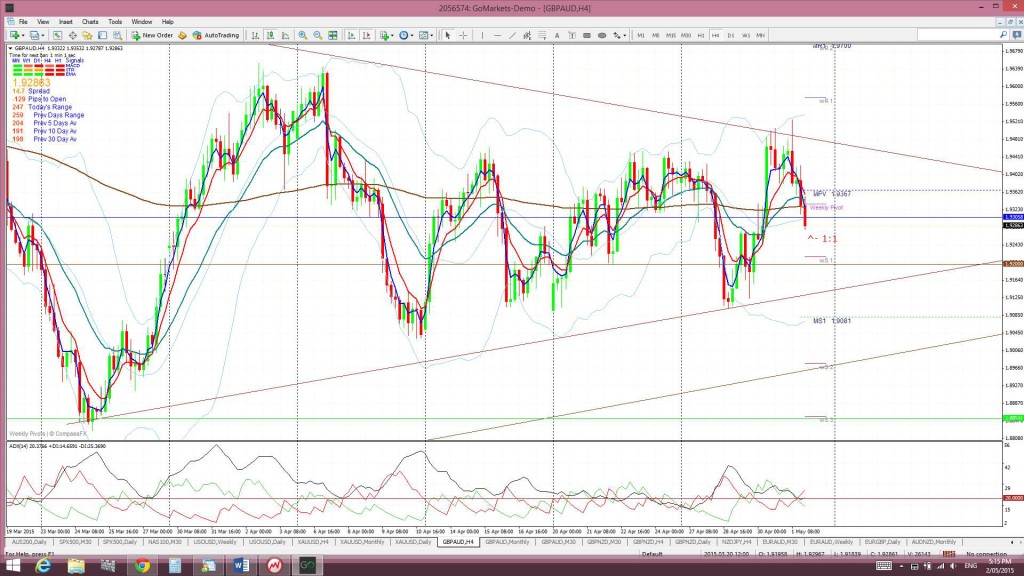
GBP/AUD: This pair chopped up and down last week and is still consolidating within a daily-chart triangle pattern. I’ll be more interested in this pair after next week’s RBA Interest Rate decision and the UK Election.
Price action is still confined within a symmetrical triangle on the daily chart. This, in turn, is set within an ascending trading channel on the weekly chart that is set within a triangle pattern on the monthly chart!
Price is now trading in the Ichimoku Cloud on the 4hr chart but above the Cloud on the daily (just), weekly and monthly charts.
The weekly candle closed as a bearish ‘Spinning Top’ candle. The April monthly candle closed as a bearish coloured Doji candle. These candles also reflect the high level of indecision with this pair at the moment.
- I’m watching for any new TC signal and the monthly chart’s bear trend line.
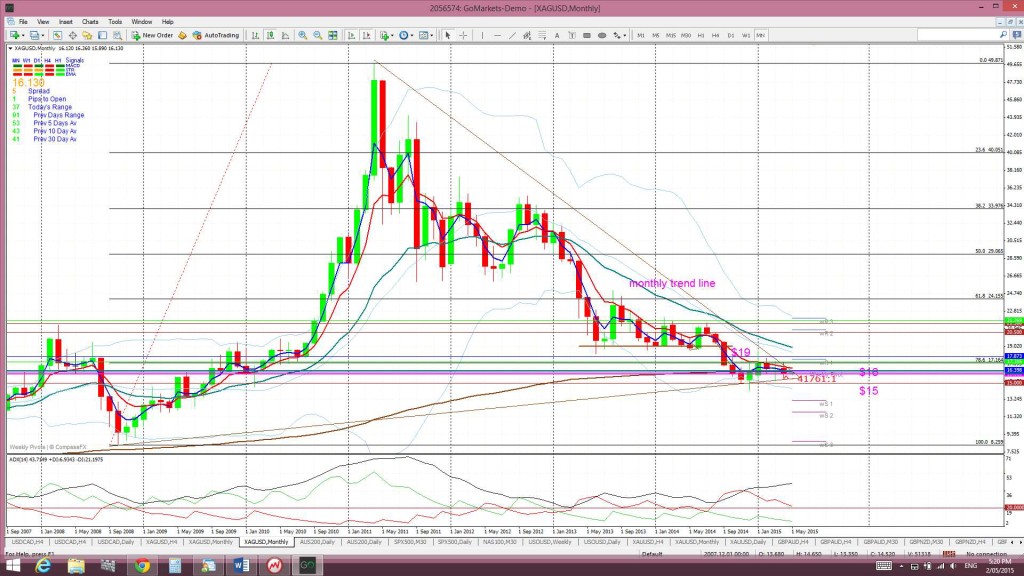
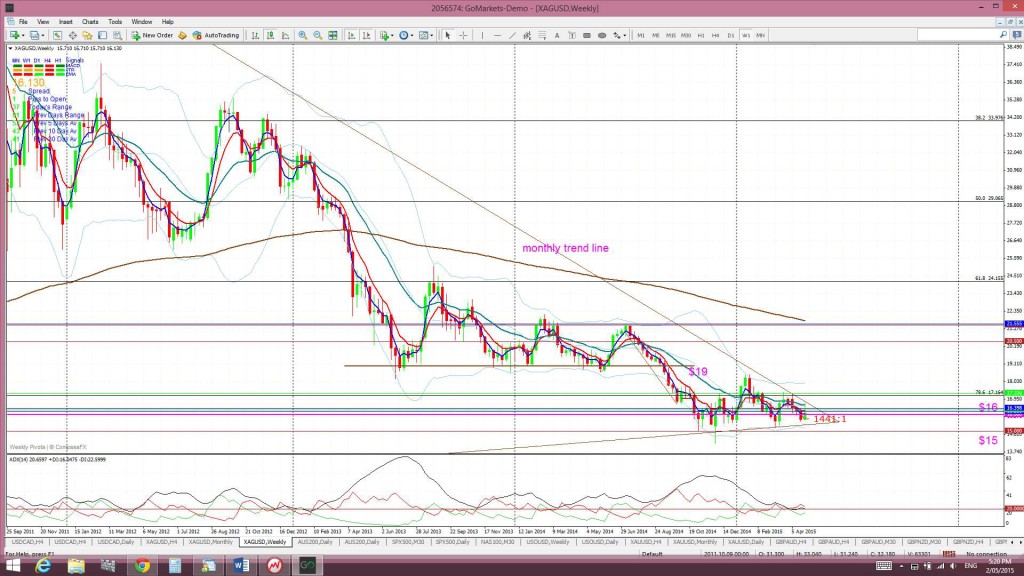
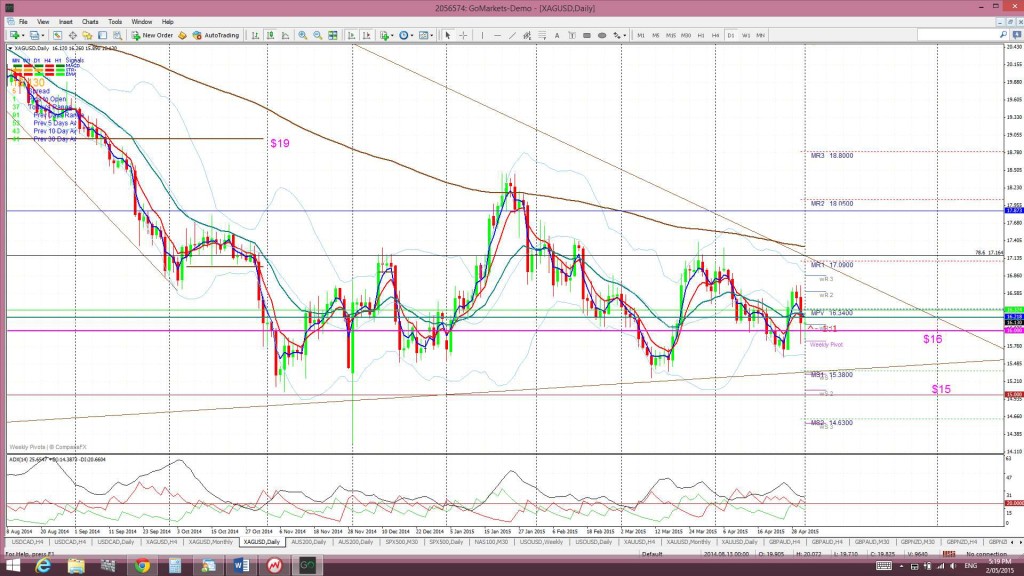
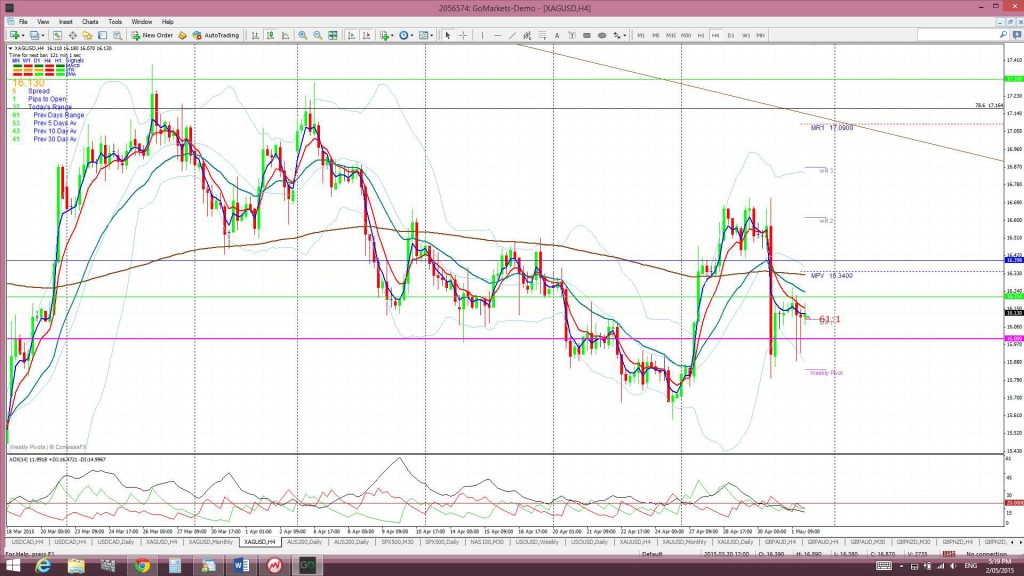
Silver: Silver chopped up and down again last week either side of $16 support. I’m still more focused on the monthly chart’s triangle trend lines and how price action is trading towards the apex of this triangle.
Silver is trading above the Ichimoku Cloud on the 4hr chart but below the Cloud on the daily, weekly and monthly charts.
The weekly candle closed as a bullish coloured ‘Inside’ candle. The April monthly candle closed as a bearish candle but almost engulfing the previous Doji.
- I’m watching for any new TC signal and the $16 and $15 levels.
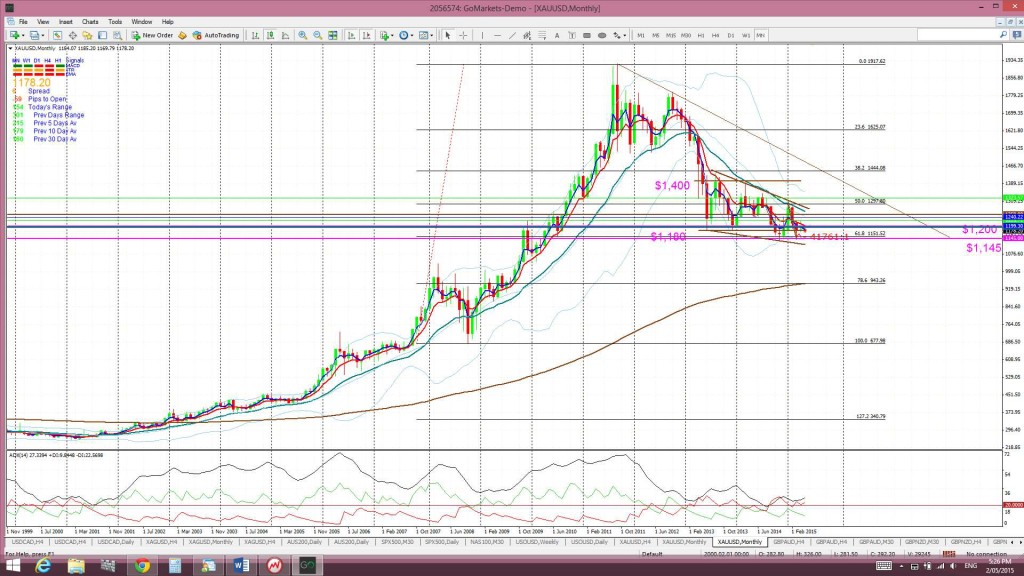
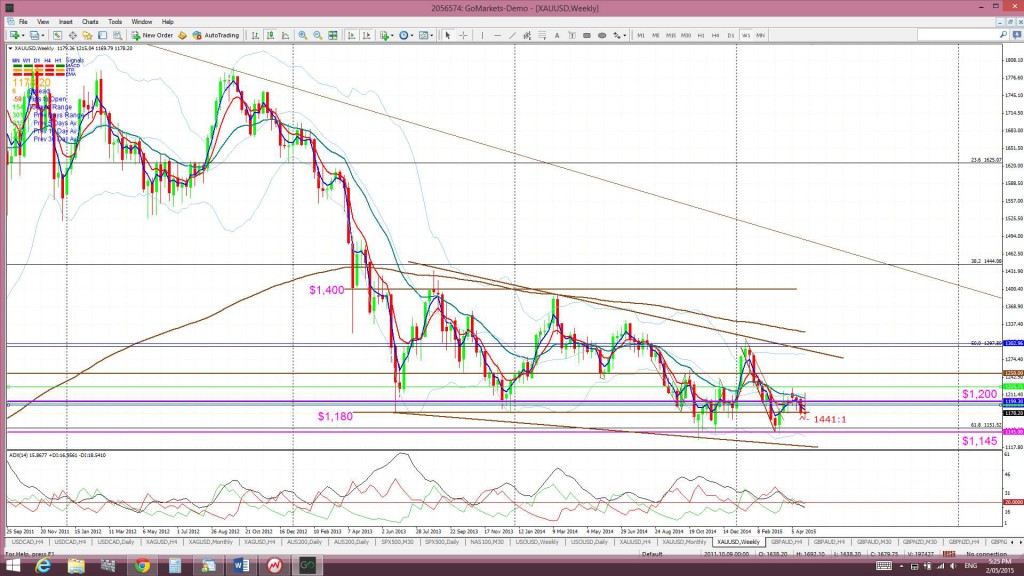
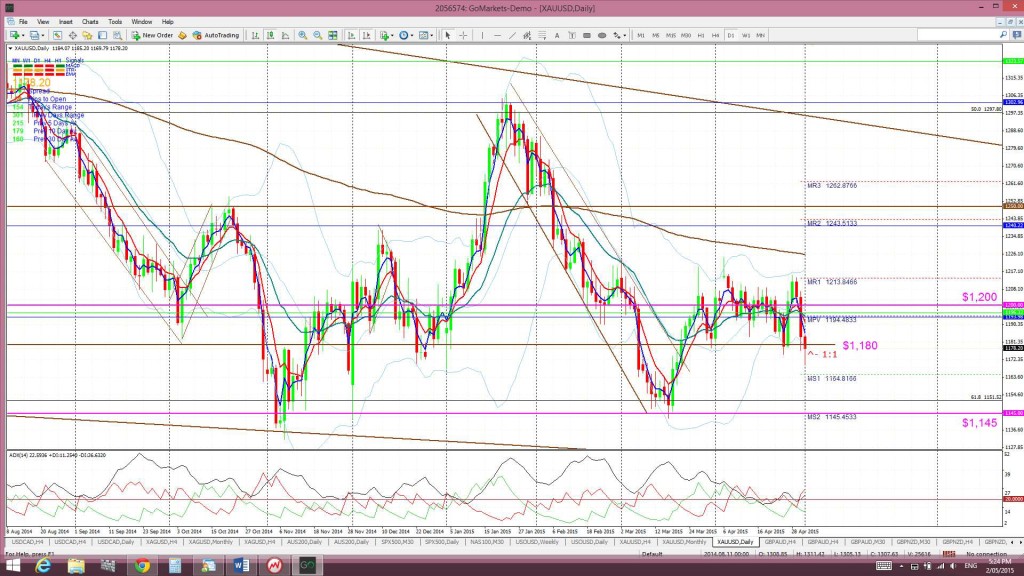
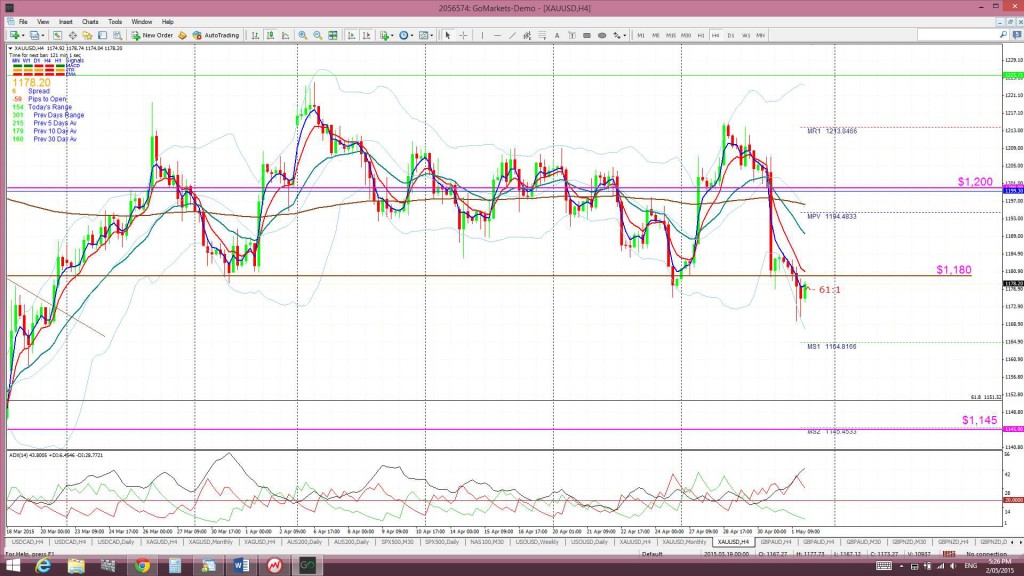
Gold: Gold chopped up and down either side of the $1,200 S/R level for most of last week but dipped on Friday to close below $1,180 support as well.
Gold does continue to hold above the 61.8% Fib retracement of the 2008-2011 bull run that is near $1,145 though. The daily, weekly and monthly charts show that Gold is really just chopping sideways above this 61.8% fib support and it seems to be waiting for the next major move with the US$.
However, any new break and hold below $1,145 would suggest a pull back. Bearish targets below $1,145 include the $1,000 psychological level and, then, the 78.6% fib near $950.
Gold is trading below the Ichimoku Cloud on the 4hr chart, in the bottom of the Cloud on the daily chart but below the Cloud on the weekly and monthly charts.
The weekly candle closed as a bearish coloured Doji candle whereas the April monthly candle closed as a bullish coloured Doji. These candles reflect the high level of indecision with Gold at the moment.
- I’m watching for any new TC signal, the triangle trend lines and the $1,200 and $1,180 levels.
The post US$ lower ahead of a big data week and the ‘Sell in May’ brigade. appeared first on www.forextell.com.

