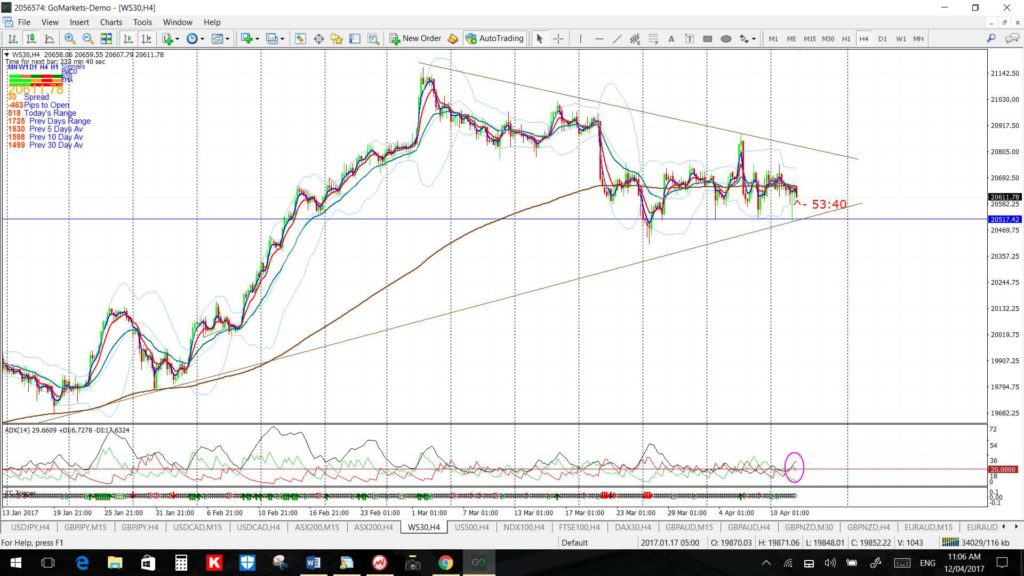
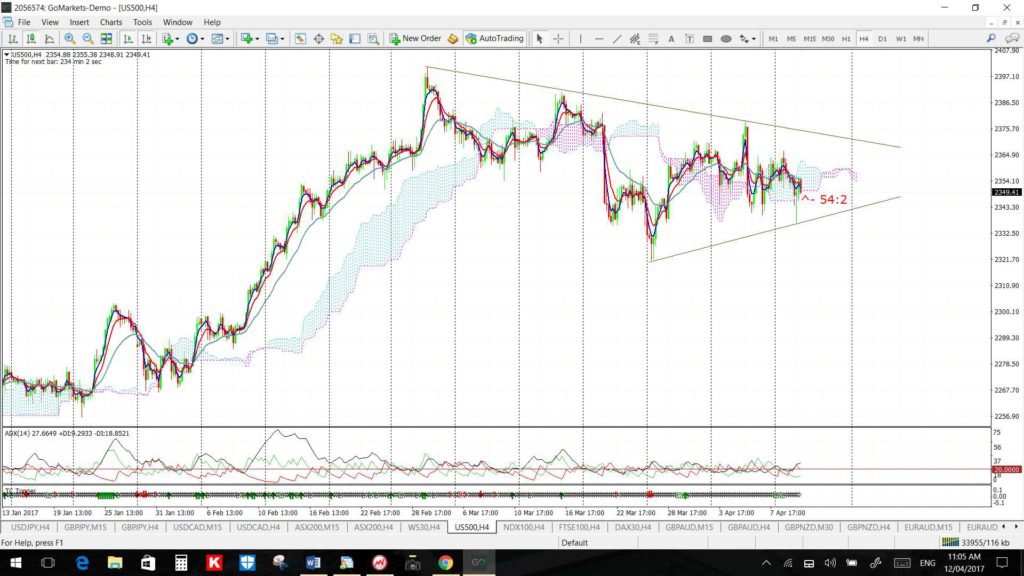
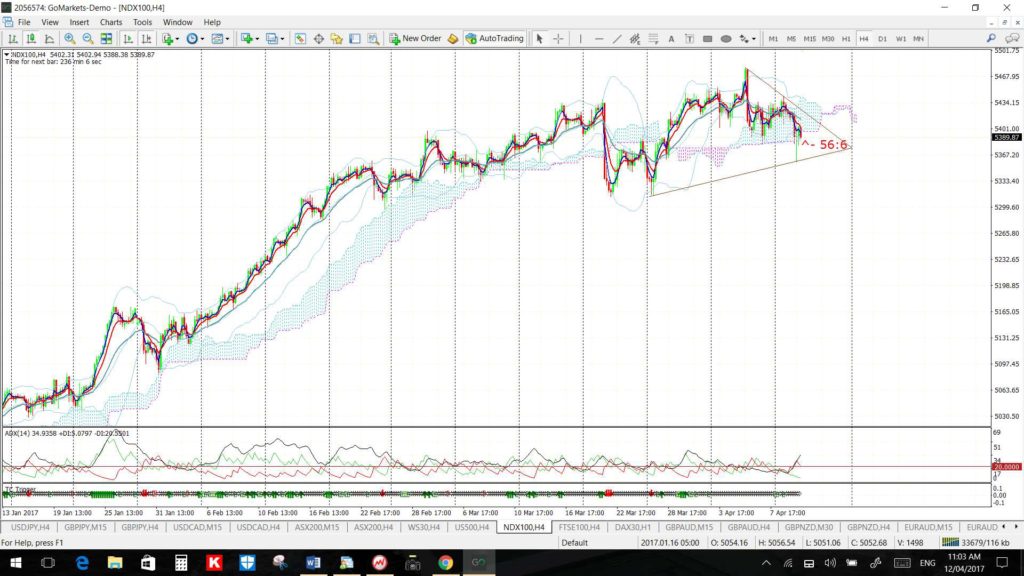
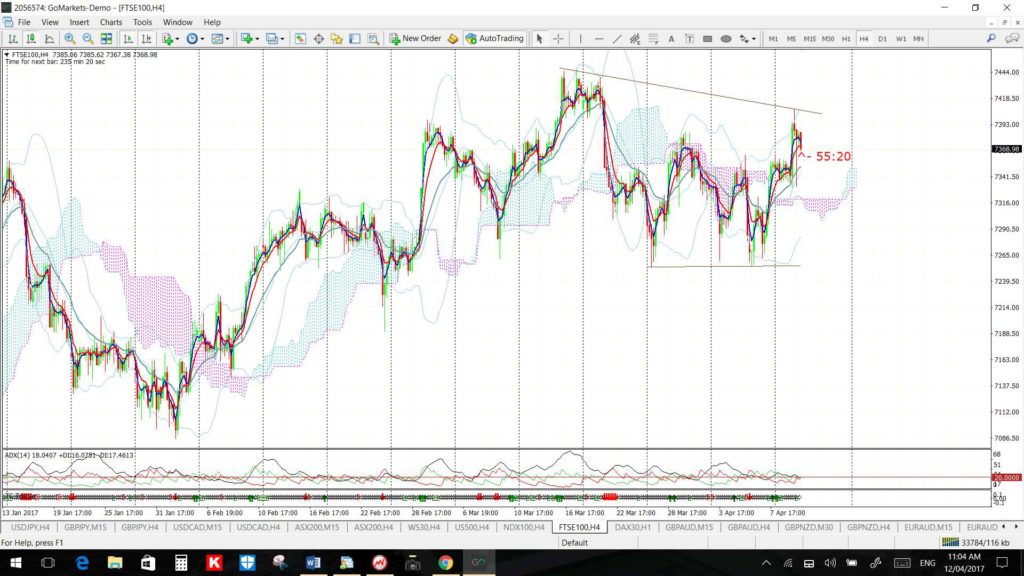
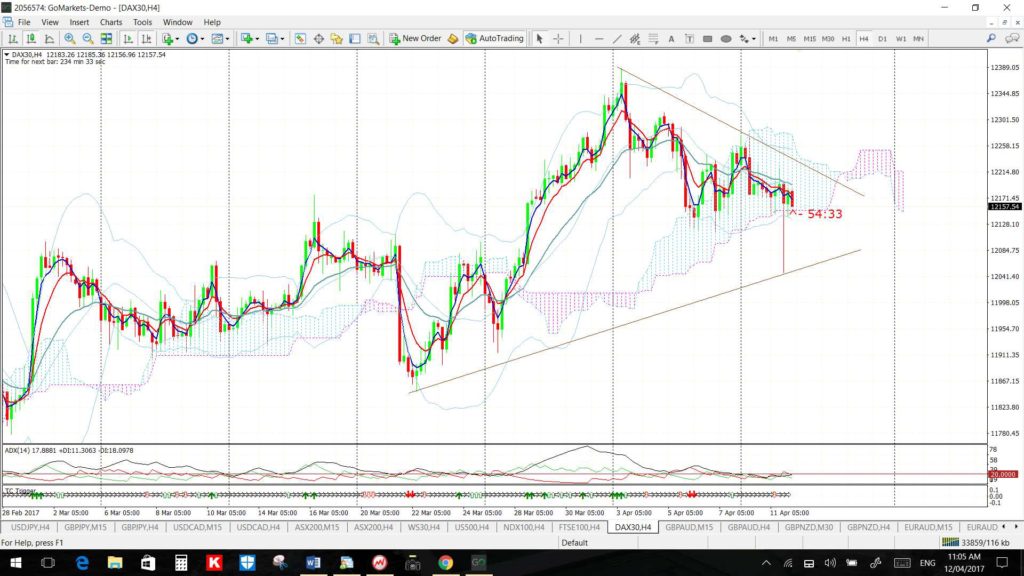
The major stock indices I have on my 4hr MT4 charts are consolidating within 4hr chart triangles during this Easter week and amid various geo-political risk events; Syria, North Korea and the Turkish Referendum as just a few. All of these patterns offer a fair bit of room for ‘more of the same’ and I would expect as much with the lighter trading over Easter unless, of course, a major risk event is triggered. The drill is the same across all of these charts: watch for any momentum-based trend line breakout.
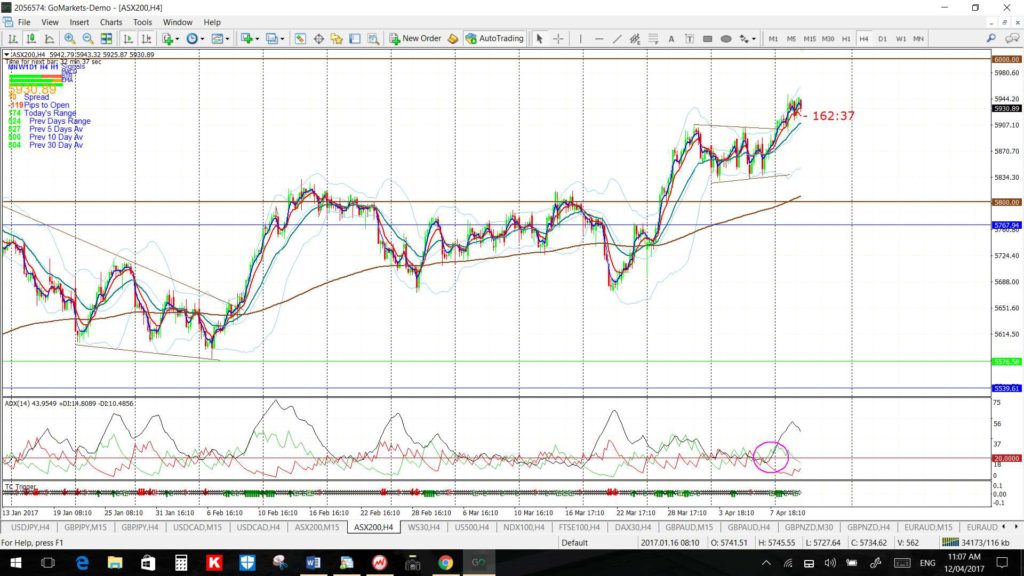
ASX-200: the 5,800 break represented a major break of an 11 year bear trend line. The psychological 6,000 is now ahead of price action.
ASX-200 4hr:
ASX-200 weekly: you can see that 6,000 is long-term S/R on this index:
DJIA 4hr:
S&P500 4hr:
NASDAQ 4hr:
FTSE 4hr:
DAX 4hr:
Source: tradecharting.com

