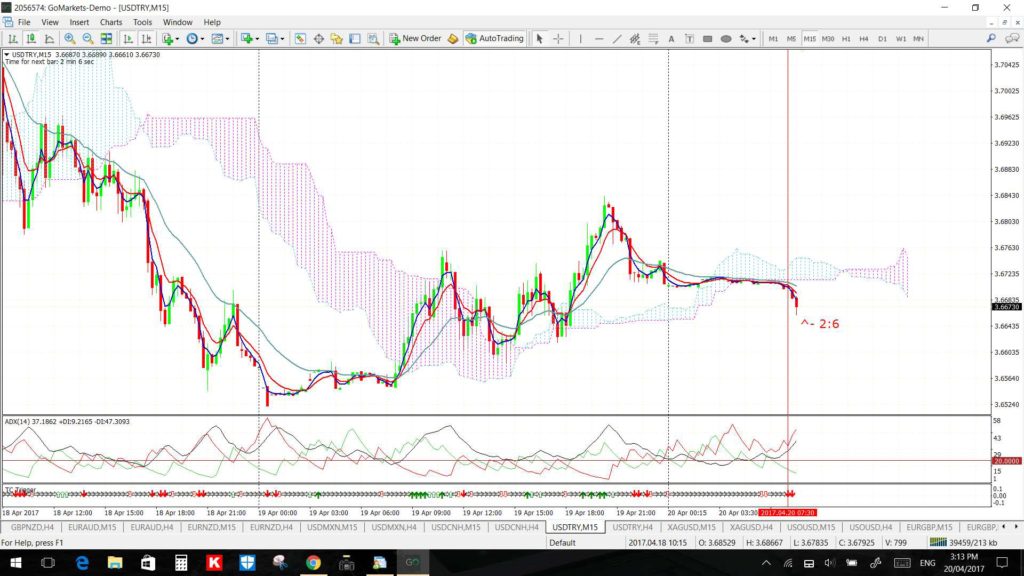
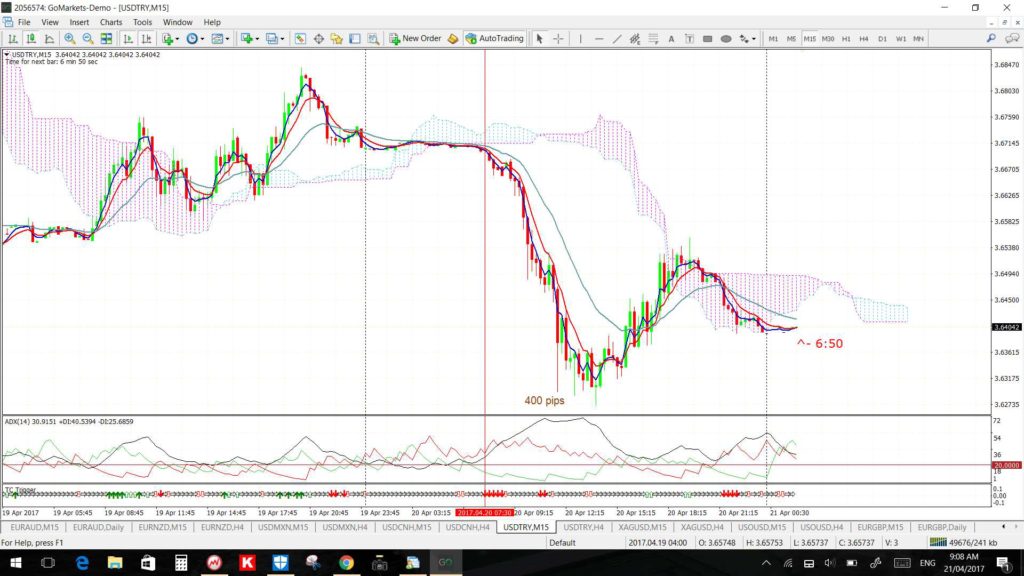
There hasn’t been much change across my FX charts and things will most likely remain slow until after the weekend’s French Presidential Election. US Earnings season is also upon us so watch for any sentiment reaction on that front. There was one great 15 min chart signal on the USD/TRY yesterday though that gave 400 pips on a move within the 4hr chart’s triangle pattern.
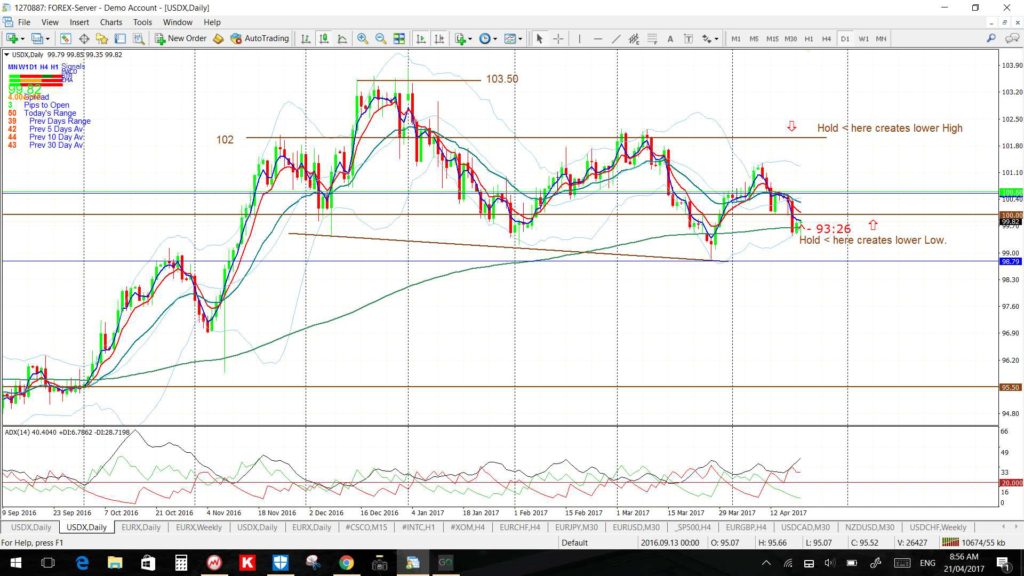
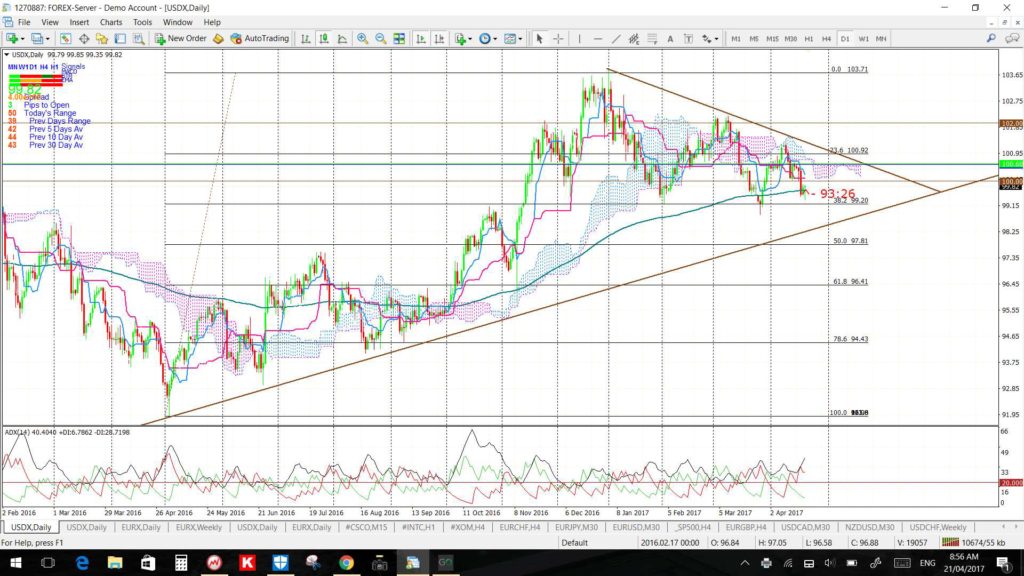
USDX: holding below 100 for now:
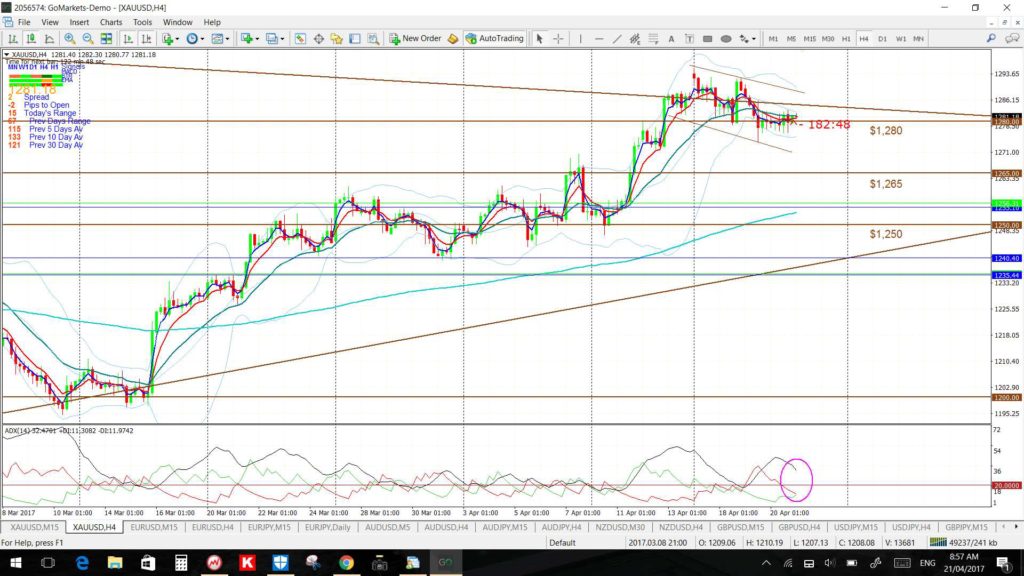
Gold 4hr: consolidating near this major 6-year bear trend line. I’m not surprised by this and would not expect this level to be broken or given up without some struggle:
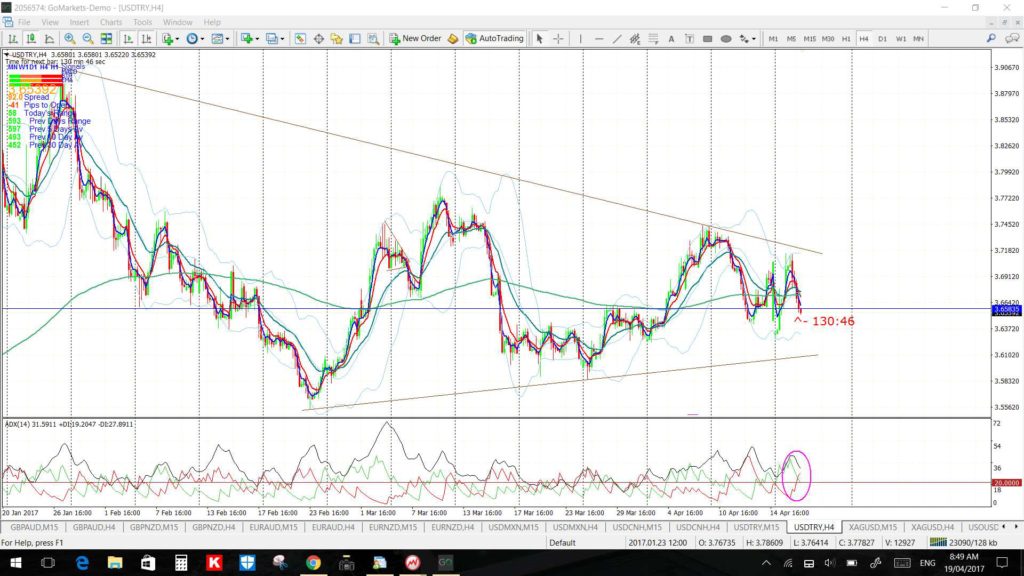
USD/TRY: this pair has been consolidating within a triangle pattern on the 4hr chart but has given a decent trend trade within this construct on the 15 min chart:
USD/TRY 4hr: the 4hr chart triangle:
USD/TRY 15 min: a new TC LONG signal triggered in my afternoon on Thursday 20th April:
This signal went on to deliver 400 pips before reversing:
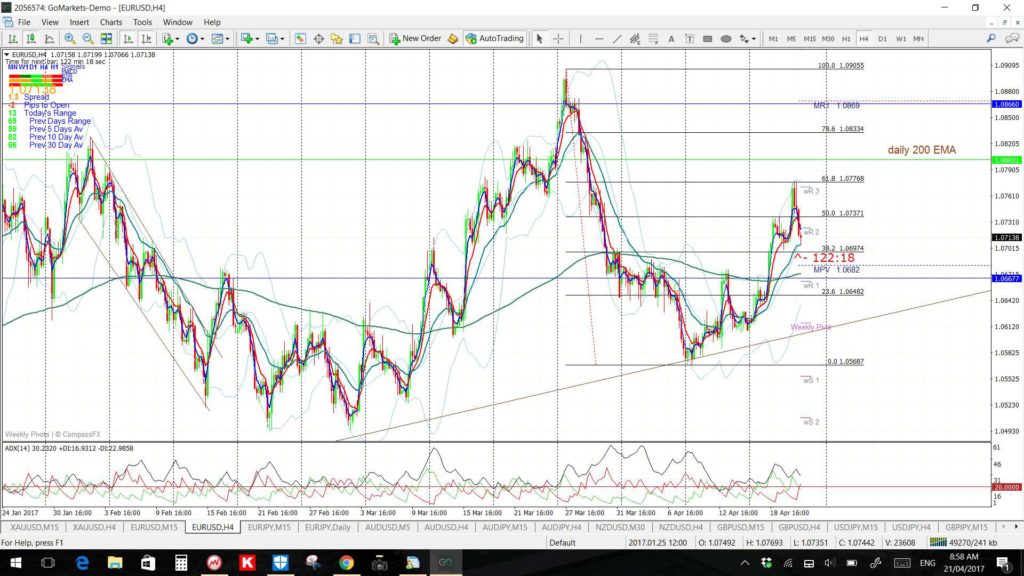
EUR/USD 4hr: another candidate for the Fibonacci school! Check the respect of the 61.8% fib!
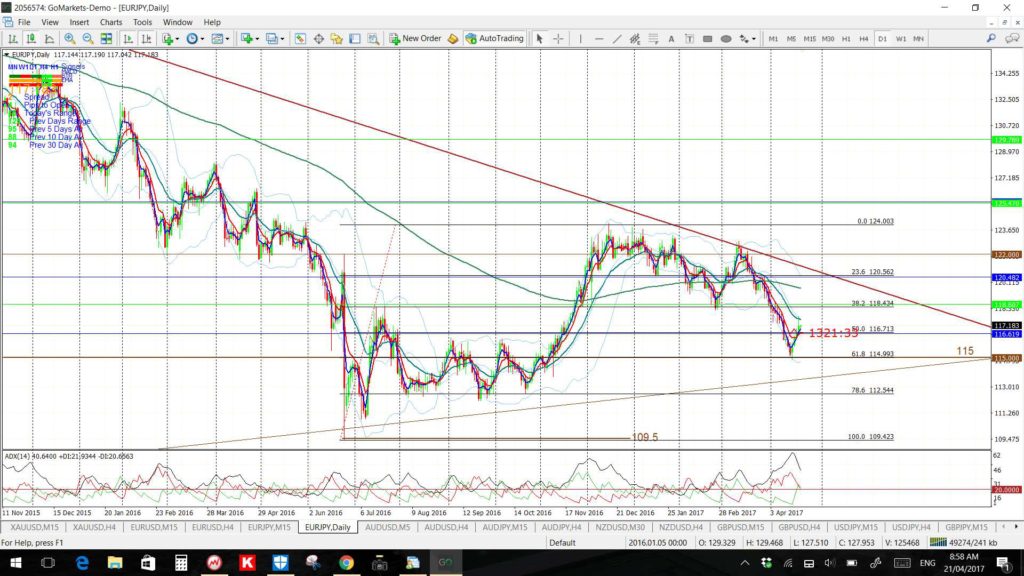
EUR/JPY daily: and another Fibonacci candidate:
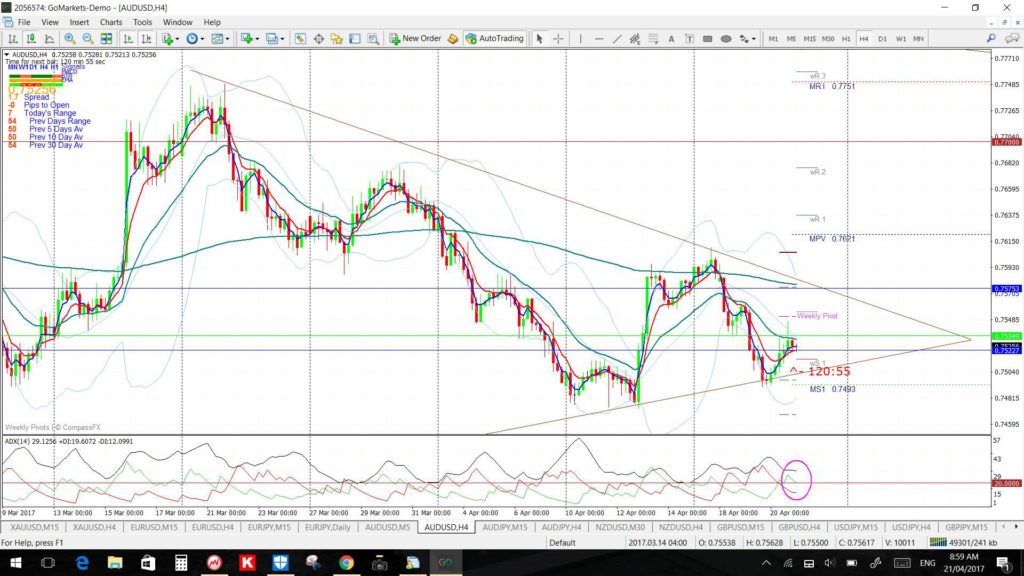
AUD/USD 4hr: ranging within the 4hr triangle:
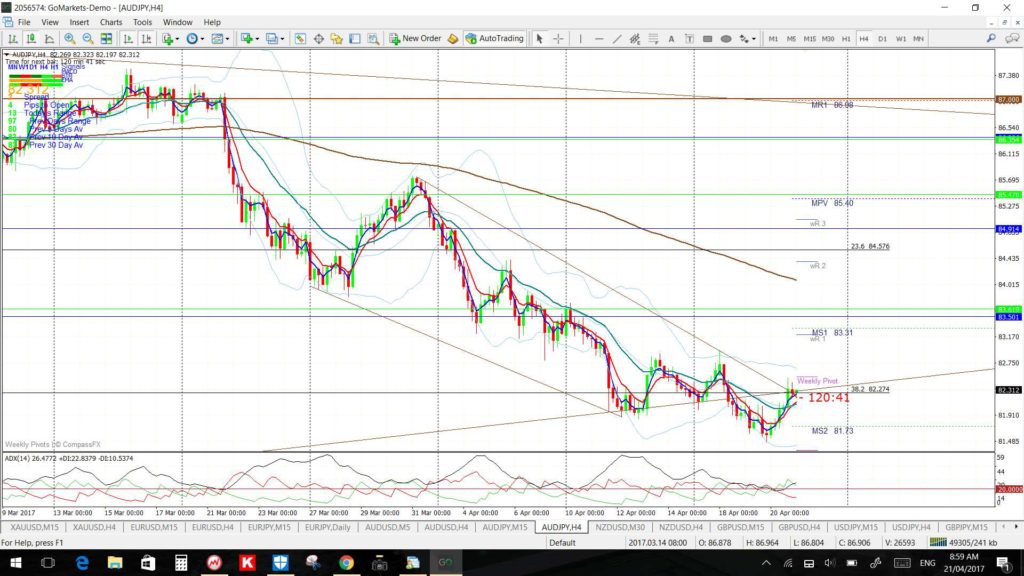
AUD/JPY 4hr: this support trend line is from the weekly chart so, any weekly candle close back above this level would add to its strength:
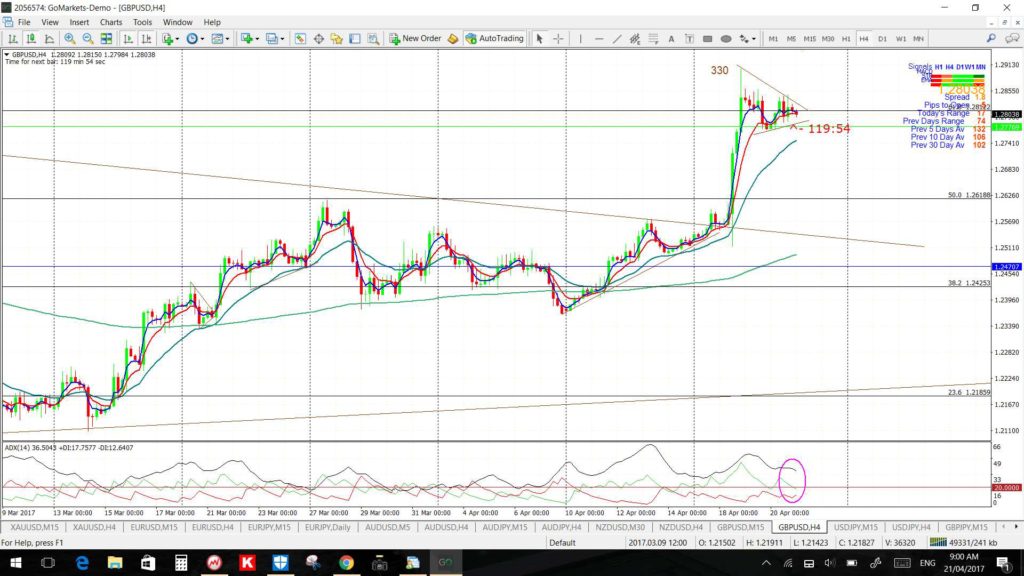
GBP/USD 4hr: consolidating after the big move earlier in the week:
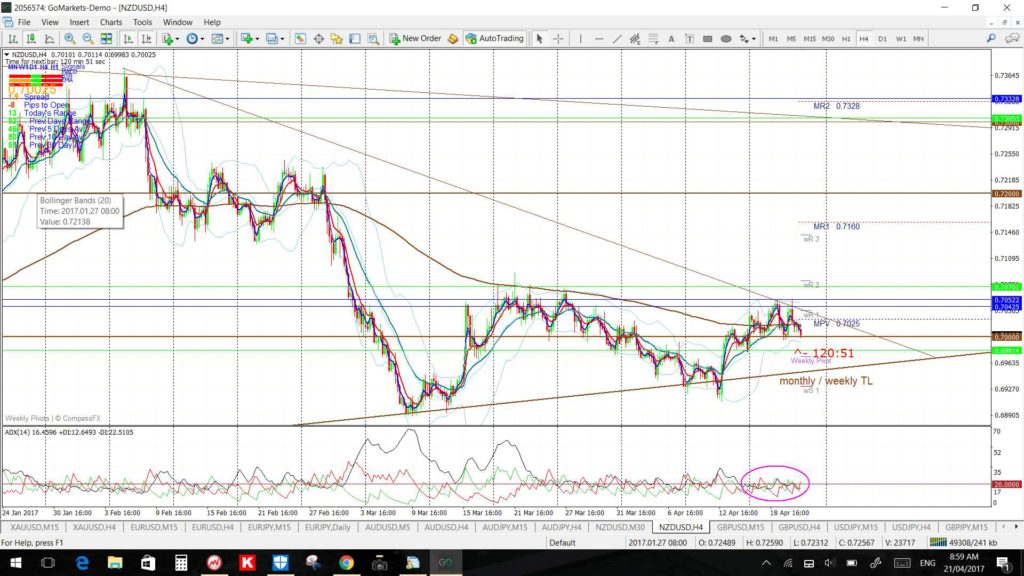
NZD/USD 4hr: consolidating:
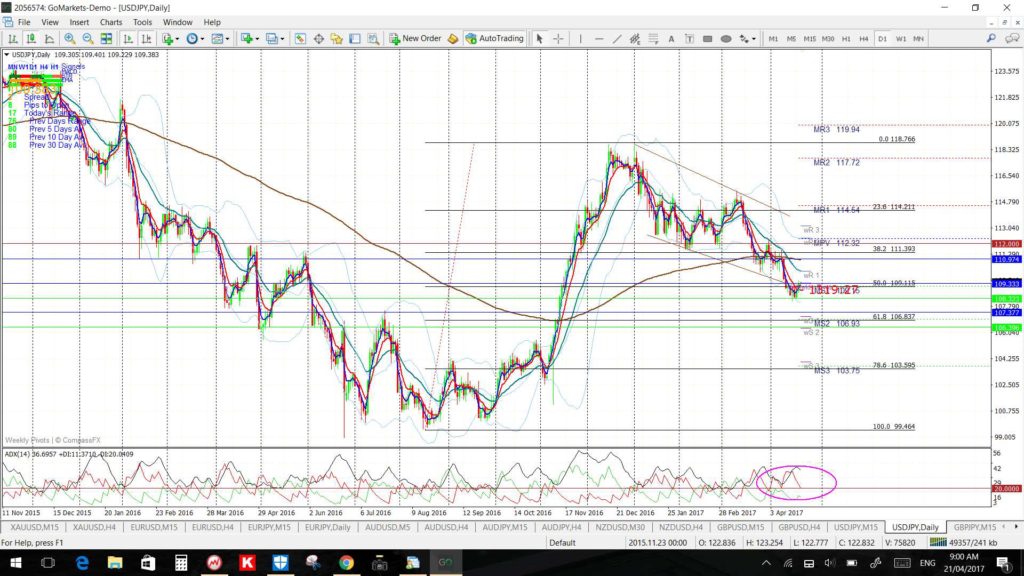
USD/JPY daily: the overall uptrend remains intact unless the 61.8% fib is broken:
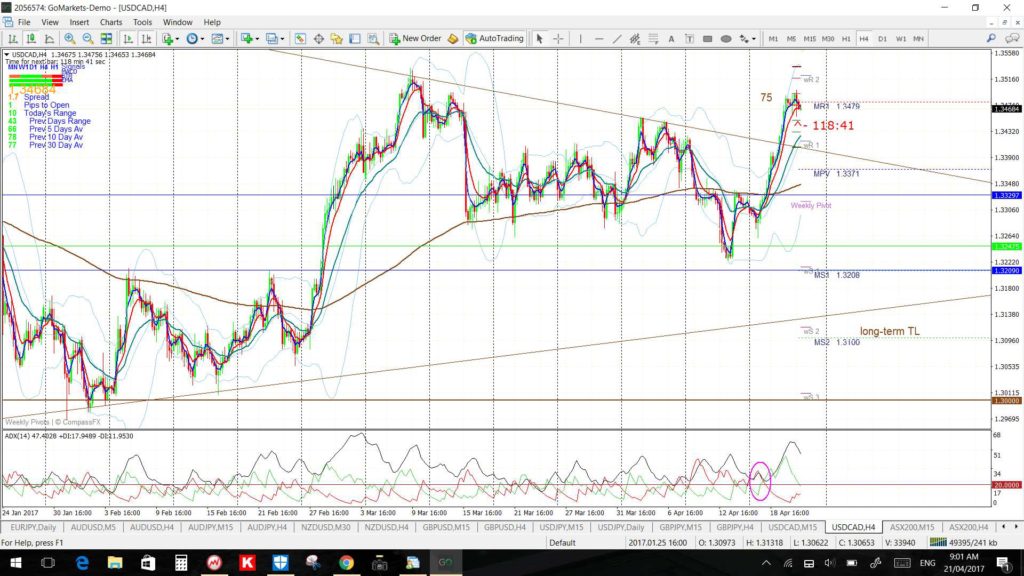
USD/CAD 4hr: a breakout starting?
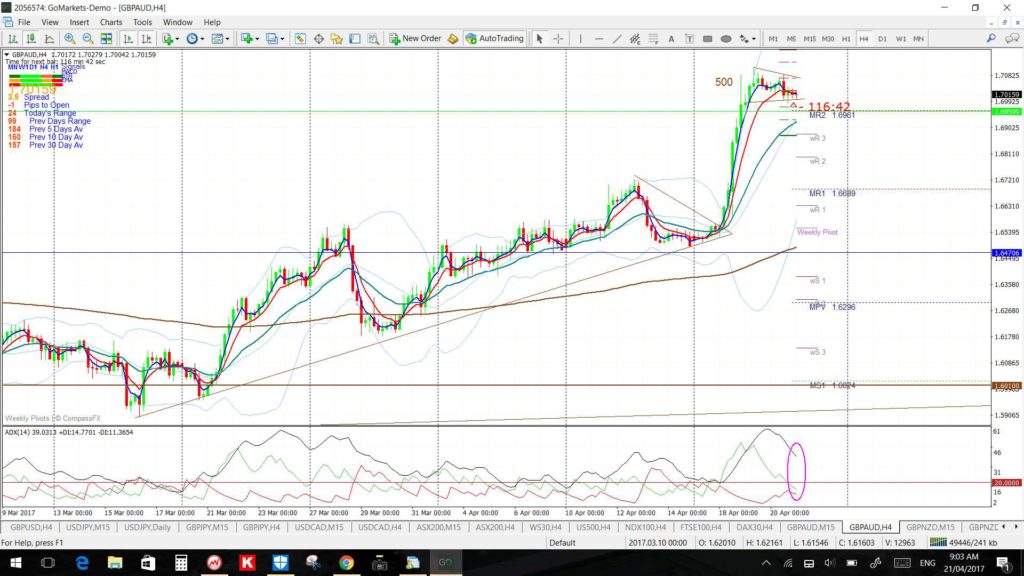
GBP/AUD 4hr: consolidating:
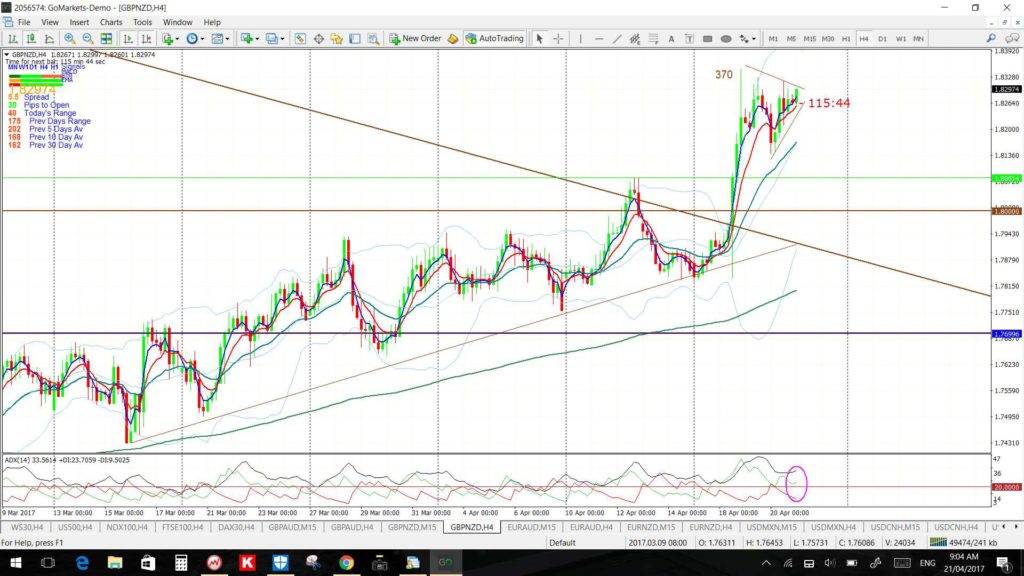
GBP/NZD 4hr: consolidating here too:
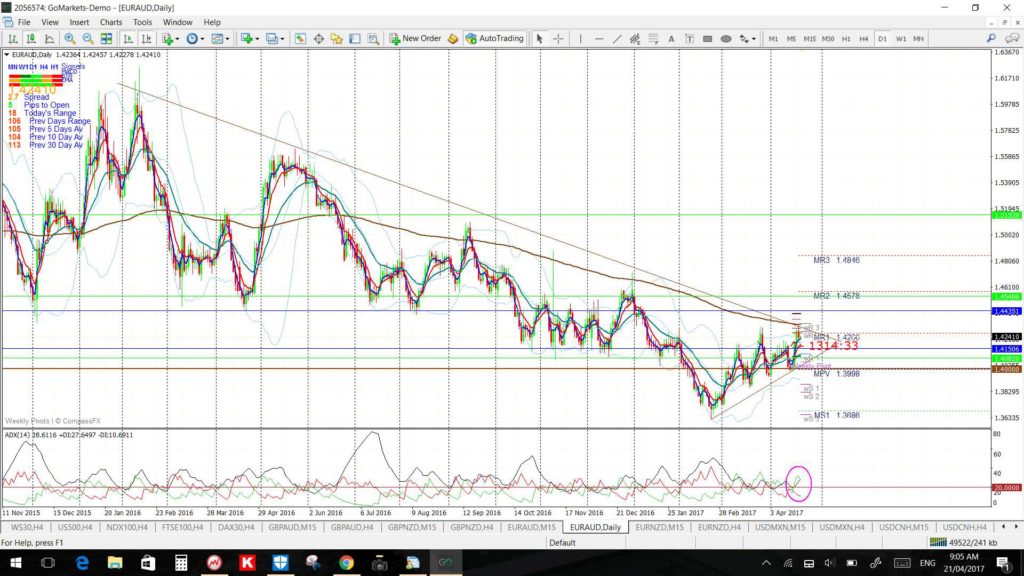
EUR/AUD daily: consolidating here too:
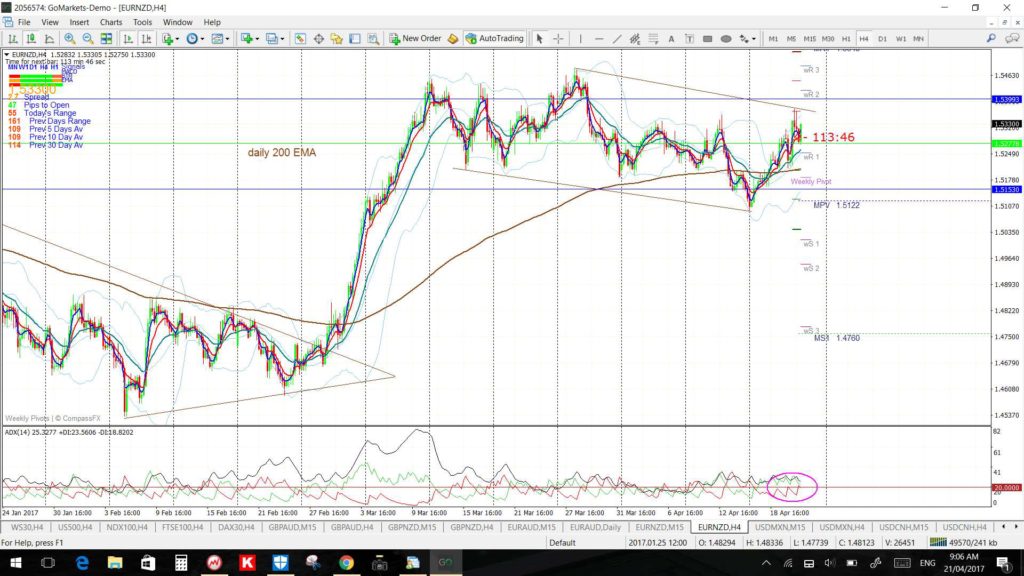
EUR/NZD 4hr: ditto:
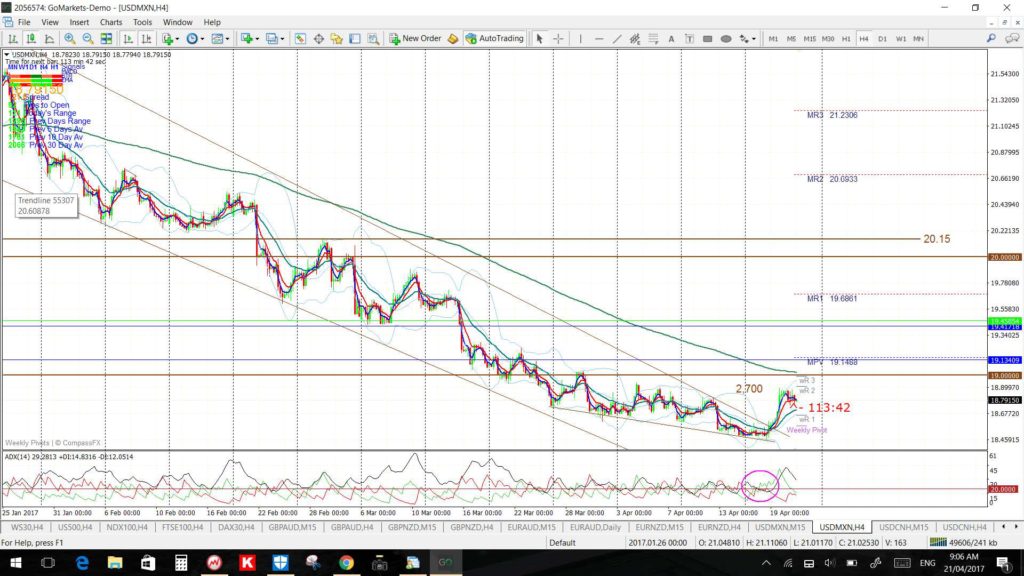
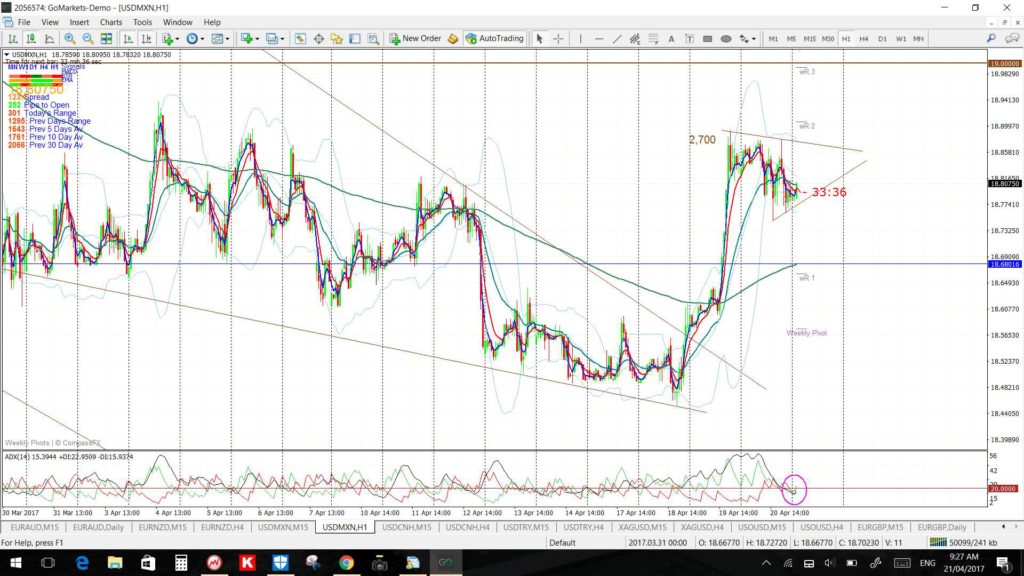
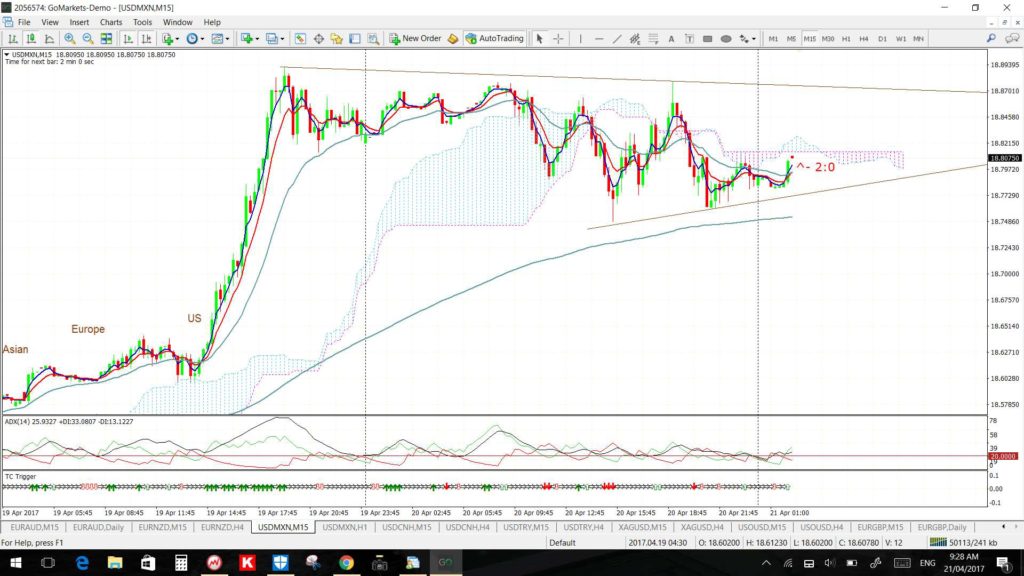
USD/MXN: consolidating under the key 19 level but watch 60 min Flag trend line for any breakout:
USD/MXN 4hr:
USD/MXN 60 min:
USD/MXN 15 min:
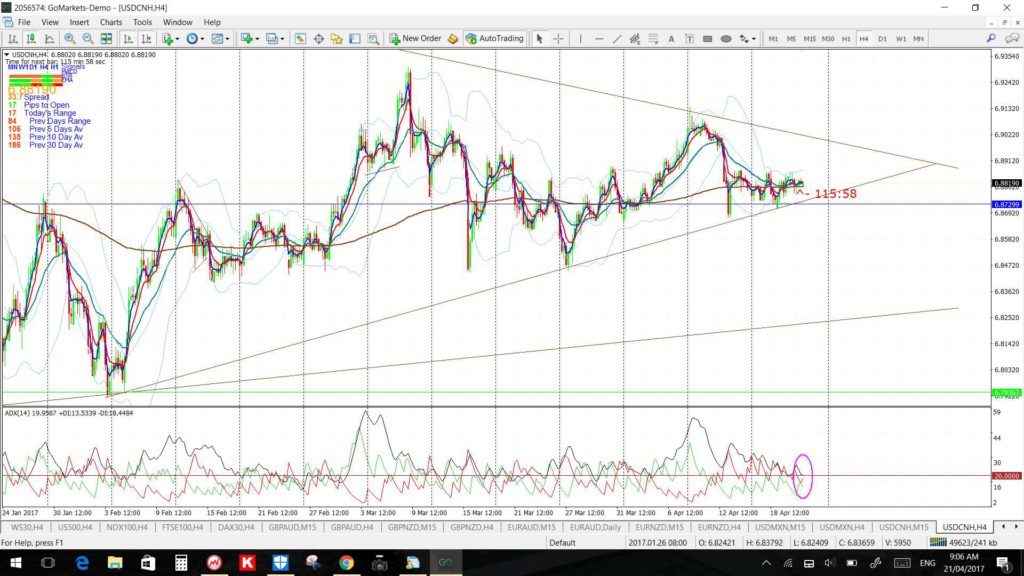
USD/CNH 4hr: consolidating in a triangle:
Source: tradecharting.com

