Last week: There were some great trend line breakouts last week however a number were marred with a savage spike courtesy of US CPI data. I had called a trade early in the week for a LONG on the AUD/USD with a target worth 190 pips up to the 4 hr chart’s 61.8% fib and previous S/R level of 0.80/. That trade unfolded perfectly; albeit for the CPI spike mid-way through the move. Many FX pairs are back near major S/R levels so watch for new make or break activity in the week ahead.
Trend line breakouts and TC signals: there were a few trend line breakout trades last week and these were updated on my site here, here and here:
- AUD/USD: 140 pips and two TC signals: one for 2.5 R and the other for 8 R.
- Gold: 300 pips and two TC signals; one for 3 R and the other for 5 R.
- EUR/USD: 270 pips and two TC signals: one for 2.5 R and the other for 8 R.
- NZD/USD: 130 pips.
- USD/JPY: 220 pips and a TC signal for 6 R.
- GBP/USD: 220 pips.
- Oil: 250 pips.
- GBP/JPY: 170 pips.
Next week:
- FX Indices: The US$ index closed lower for the week but held above major support. An update on the FX indices can be found through this link.
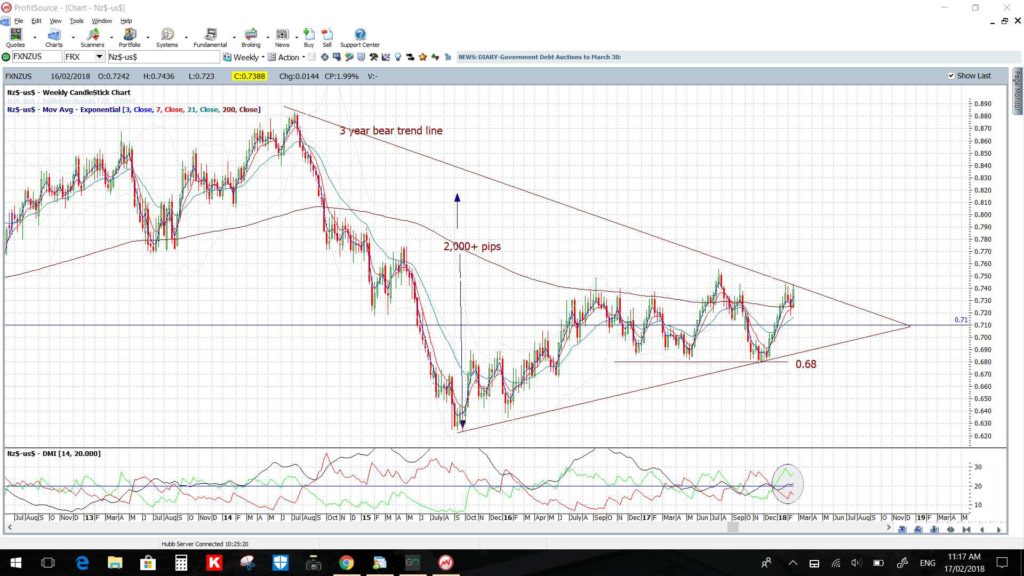
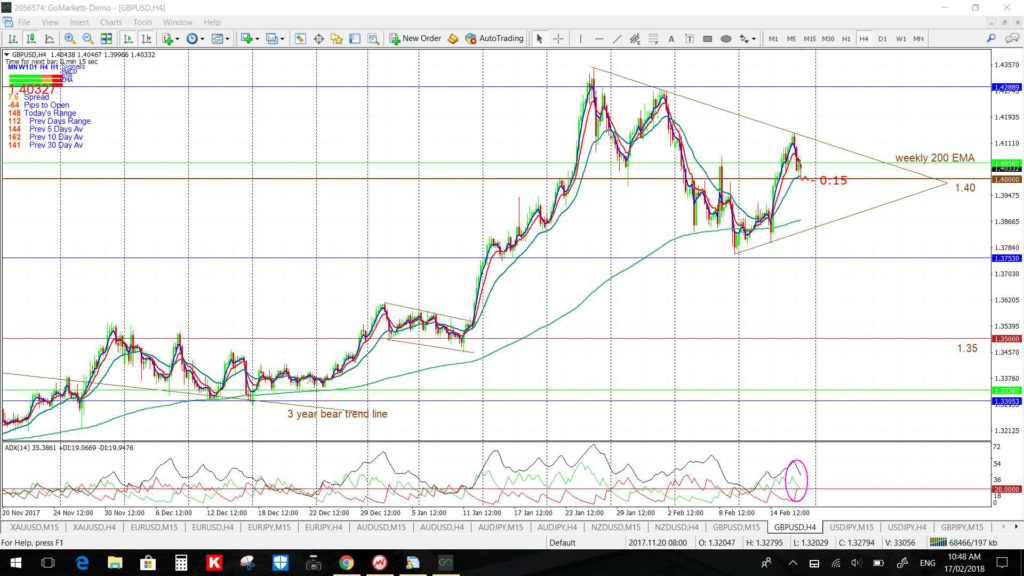
- Major levels: I have noted over recent weeks about how many FX pairs have been negotiating major levels and some of these are back in focus again this week: The 0.80 on AUD/USD, 1.40 on GBP/USD, 1.26 now for the EUR/USD, 0.74 for the NZD/USD, 133 now for the EUR/JPY, $10,000 now on BTC/USD and $1,400 for Gold.
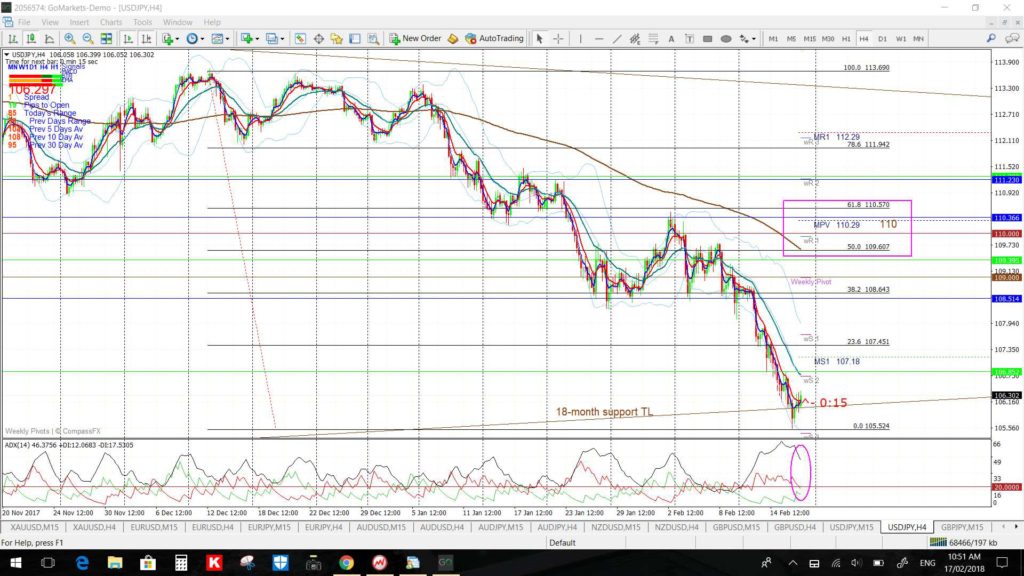
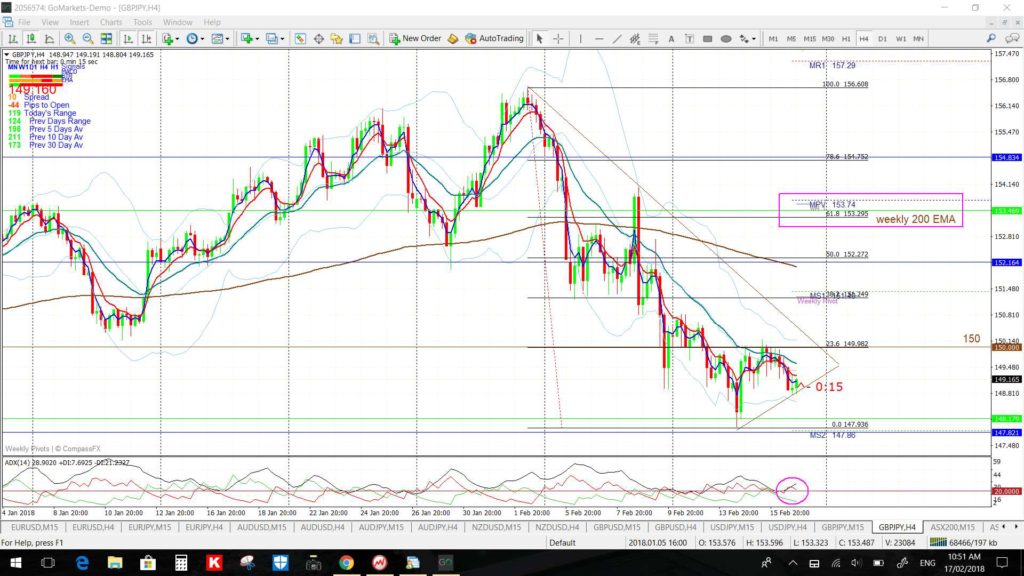
- Yen strength: There has been a fair bit of Yen strength over the last two weeks but, with the USD/JPY sitting on a long-term support trend line, I’ll be on the lookout for any recovery moves; even if any relief is only brief. The 4hr charts of the EUR/JPY, AUD/JPY, GBP/JPY and USD/JPY show the 61.8% retracement fib back at previous S/R levels on these pairs and so I’ll be watching for any relief activity to potentially test these key levels.
- Gold: is just 550 pips away from the all-important $1,400 S/R level so watch for any push higher to test this key S/R region.
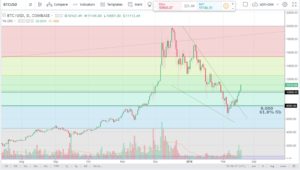
- Bitcoin: Bitcoin has rallied over 25% since last week and has made a weekly close above the 50% fib near $10,000. I have reviewed the charts of Bitcoin and noted potential targets for any bullish continuation from these levels. This article can be found through the followinglink.
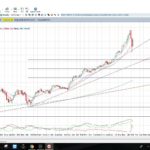
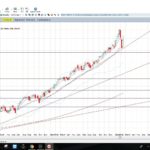
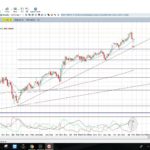
- US Stocks: the major indices all printed bullish weekly candles although those for the S&P500 and DJIA were indecision-style ‘Inside’ candles. However, the major support trend lines continue to hold and, even if they do break to the downside, I would still then be wary of any Bull Flag style activity (click on charts to enlarge view):
- S&P500 weekly
- DJIA weekly
- NASDAQ weekly
- Russell-2000 weekly
- ASX Stocks: there are a few on my radar this week and you can read about them in an article found through this link.
- Monday Holiday in USA: There is a public holiday in the USA on Monday for Presidents’ Day so it might be a slow start to the week.
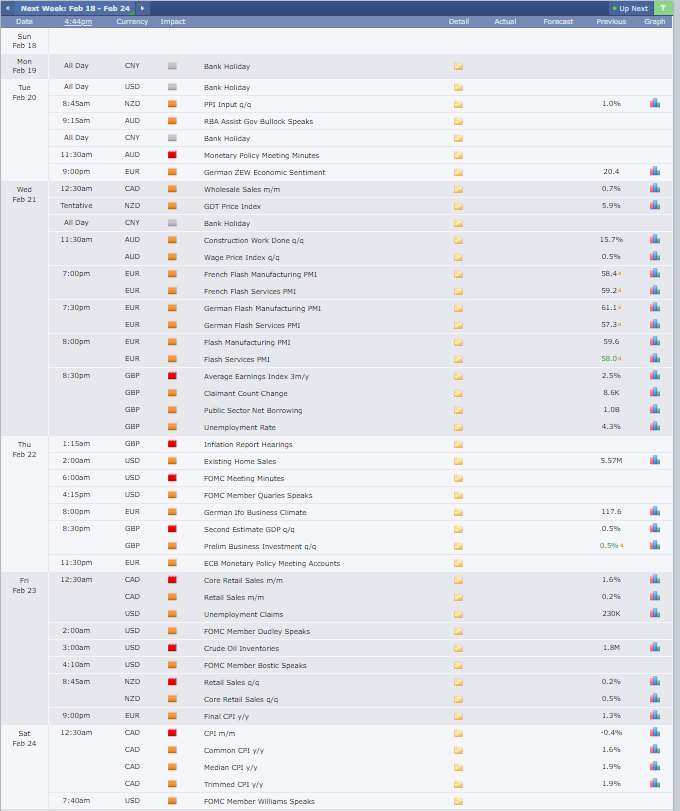
Calendar: Watch out for impact from high impact data and there are a lot of second tier EUR PMIs to consider as well. There is a public holiday in the USA on Monday for Presidents’ Day so it might be a slow start to the week:
Forex:
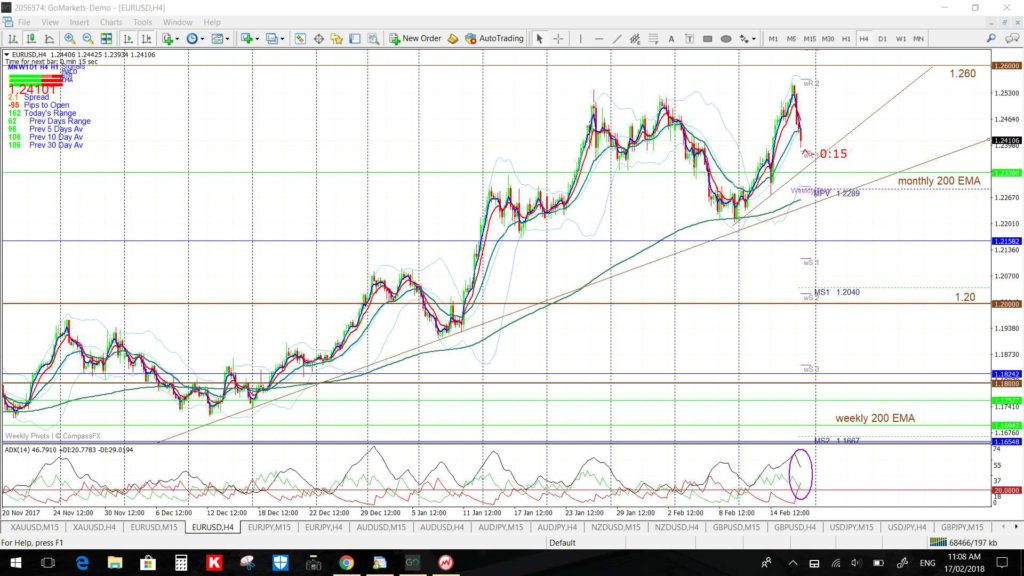
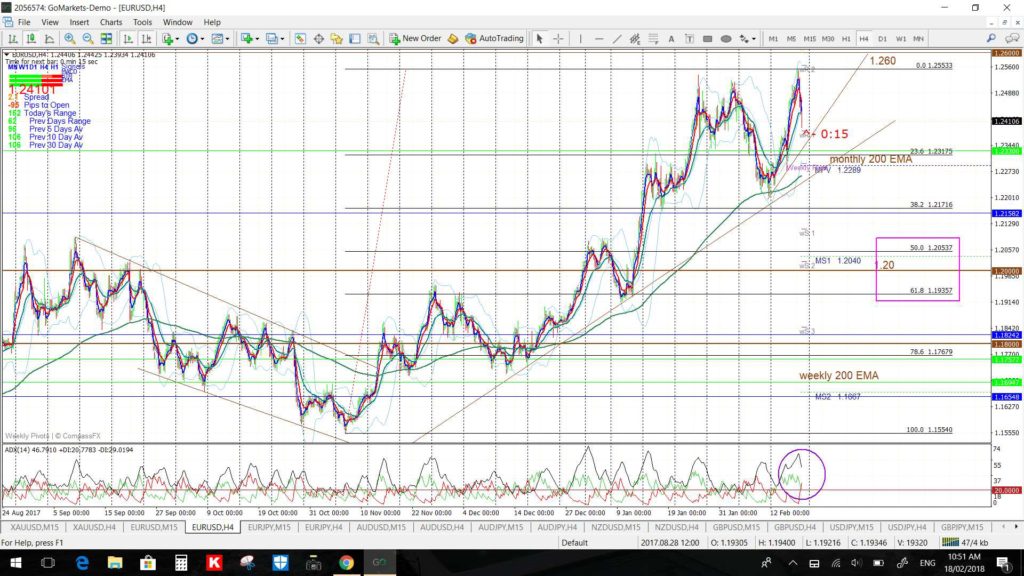
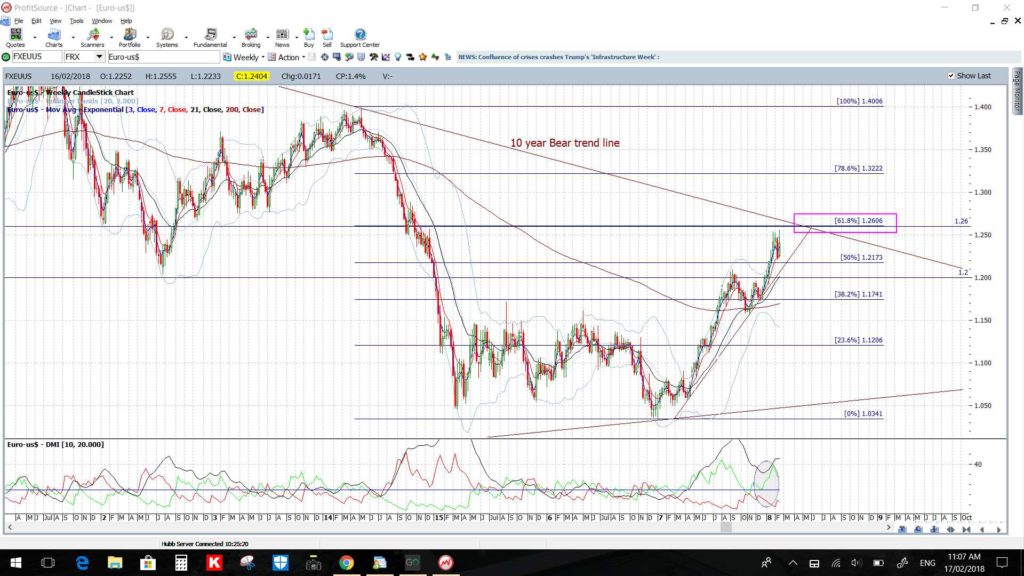
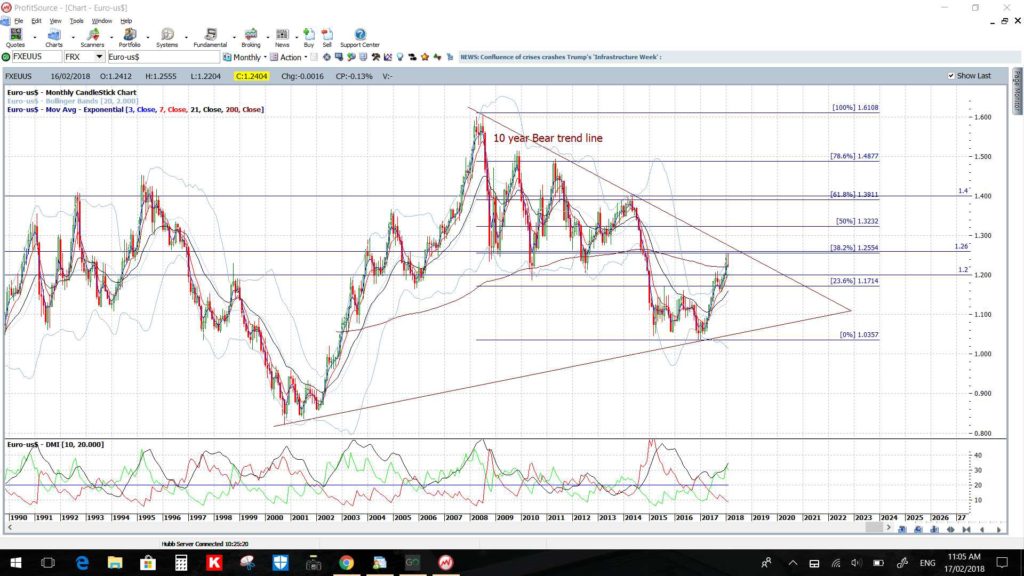
EUR/USD: This pair continues to consolidate below the major 1.26 level. This is a major level for this pair as the weekly chart’s 61.8% fib is near 1.26 and it also intersects with the monthly chart’s 10-year bear trend line. Thus, the 1.26 remains as the major level to monitor in coming sessions.
Note on the monthly chart below how the 61.8% fib of the swing low move is up near previous S/R at 1.40 so this would be the longer-term target on any break and hold above 1.26. This constitutes a move worth 1,400 pips so is well worth motioning.
Any pullback would have me looking for a test of the support trend lines and the key 1.20 level.
- Watch the 4hr chart trend lines for any new breakout.
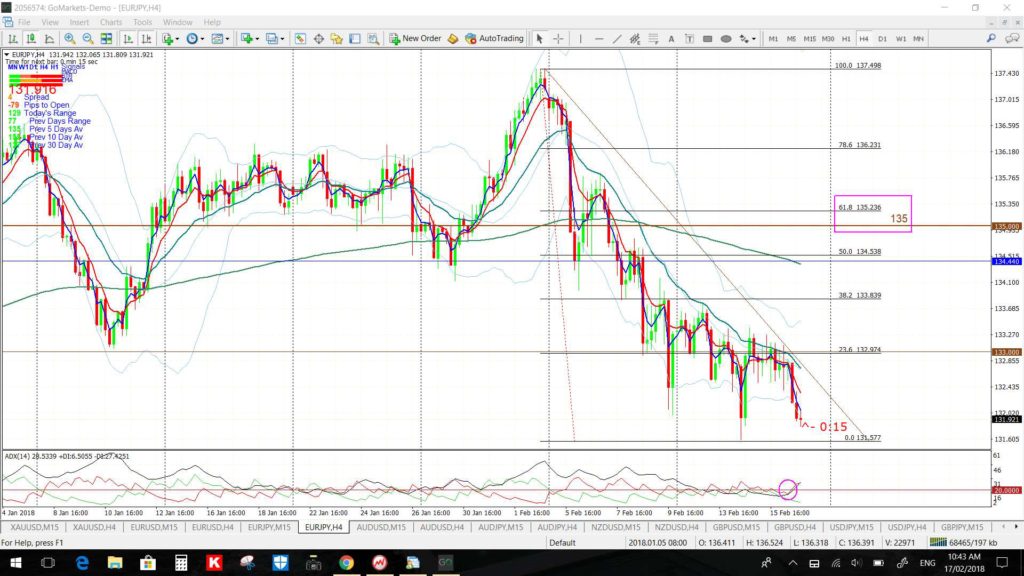
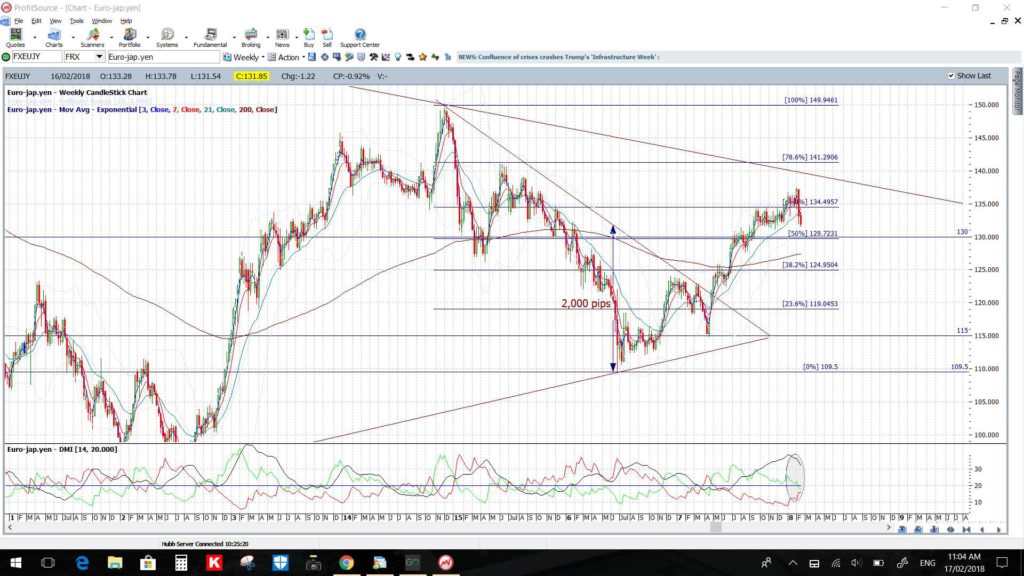
EUR/JPY: Given we’ve had weakness for the last two weeks I’m on the lookout for any test of the major 135 S/R level here as I note it is the 4hr chart’s 61.8% fib.
Any break lower would have me looking to the 130 S/R level.
- Watch the 4hr chart trend lines for any new breakout.
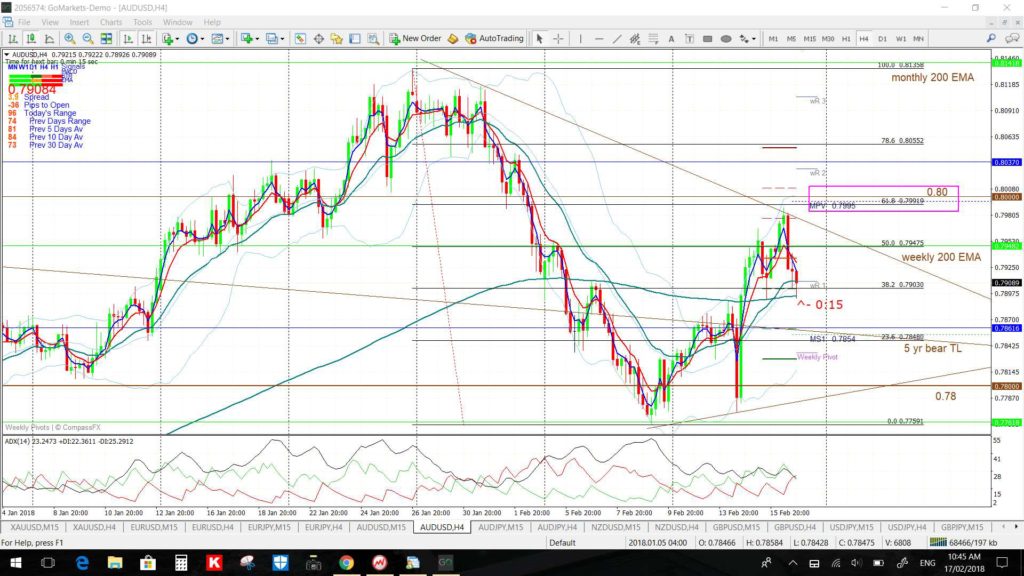
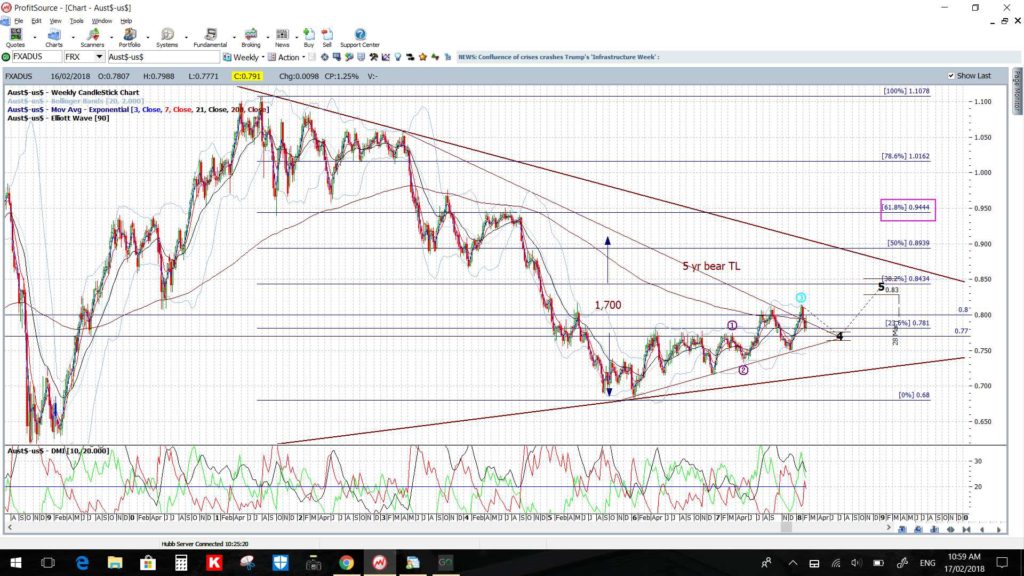
AUD/USD: The Aussie gave another great technical pullback last week with its recovery back up to the 4hr chart’s 61.8% fib near 0.80. I’d mentioned this level in a Tweet on Monday week so was spot on here 🙂 ! It failed to close the above this key S/R level though but there are new triangle trend lines to watch for any momentum breakout.
- Watch the revised triangle trend lines and 0.80 level for any new breakout; especially with the AUD Monetary Policy Meeting Minutes:
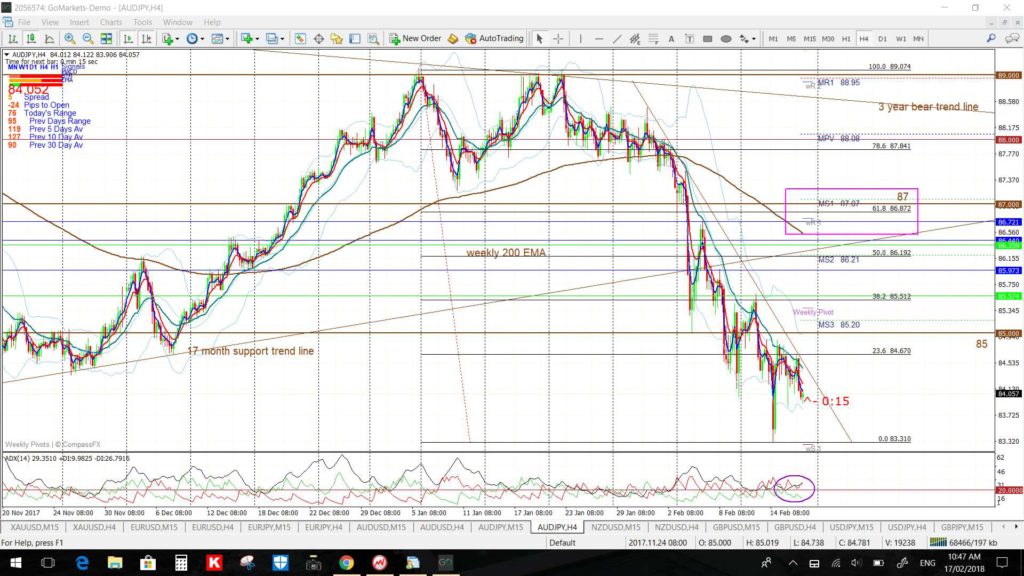
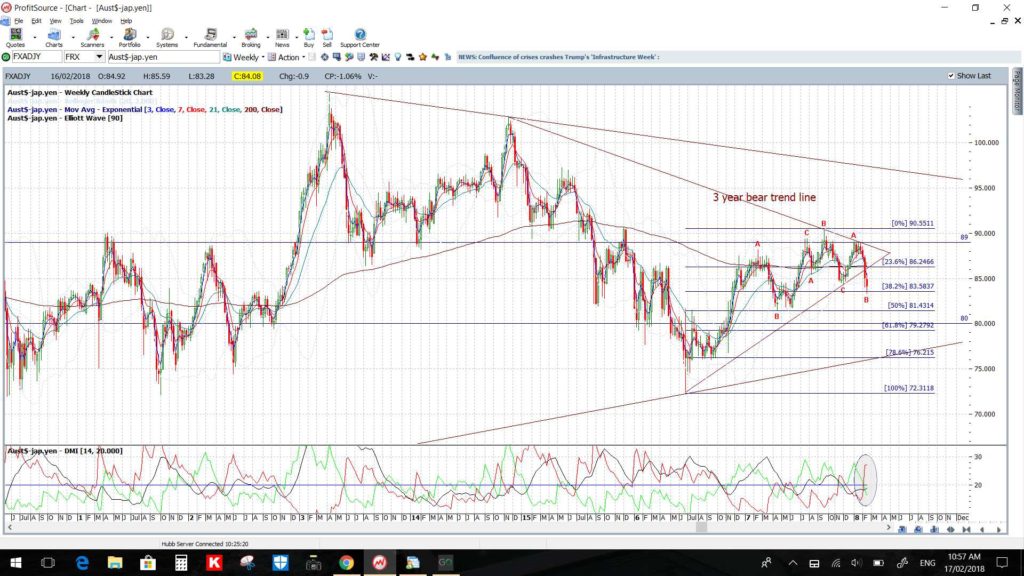
AUD/JPY: As with the weakness on the EUR/JPY, I’m watching for any test of the 87 S/R level here as I note it is the 4hr chart’s 61.8% fib.
Any break lower would have me looking to the weekly chart’s 61.8% fib down near 80 S/R.
- Watch the 4hr chart trend lines for any new breakout.
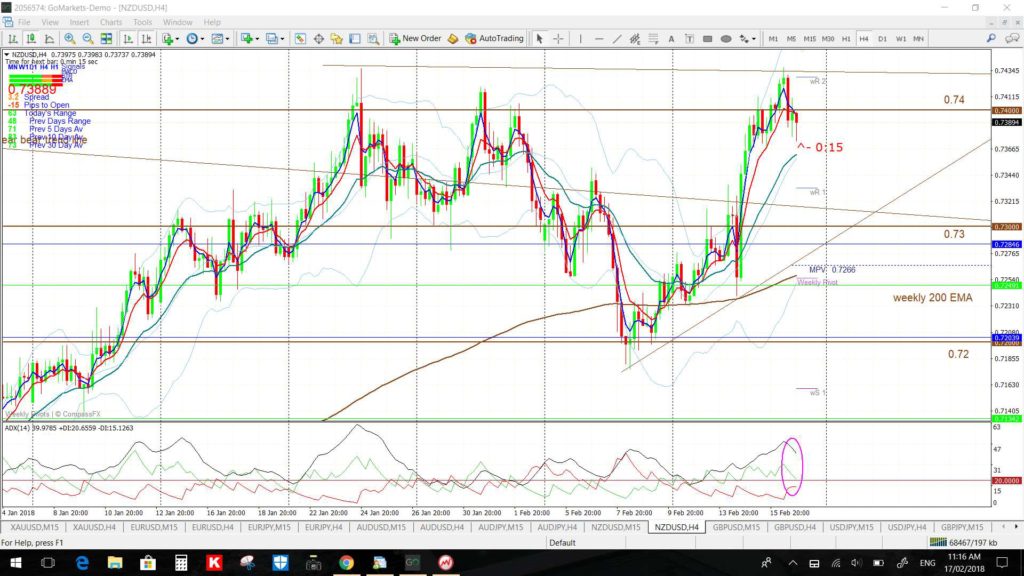
NZD/USD: The Kiwi continues to hover near the major 0.74 level and so this remains the level to watch for any new make or break.
- Watch the 4hr chart trend lines for any new breakout; especially with this week’s NZD Retail Sales data.
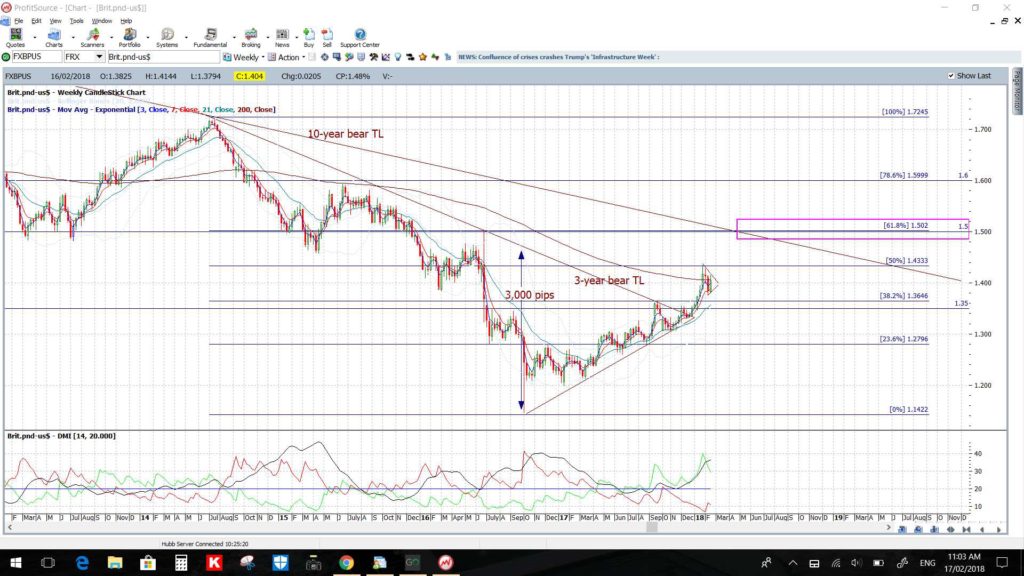
GBP/USD: Price action continues to consolidate near the 1.40 level and weekly 200 EMA. This still has a Bull Flag look to it…IMHO that is.
- Watch the triangle trend lines and 1.40 level for any new breakout, especially with this week’s Employment and GDP data, the Inflation Report Hearings and the BoE Carney speech:
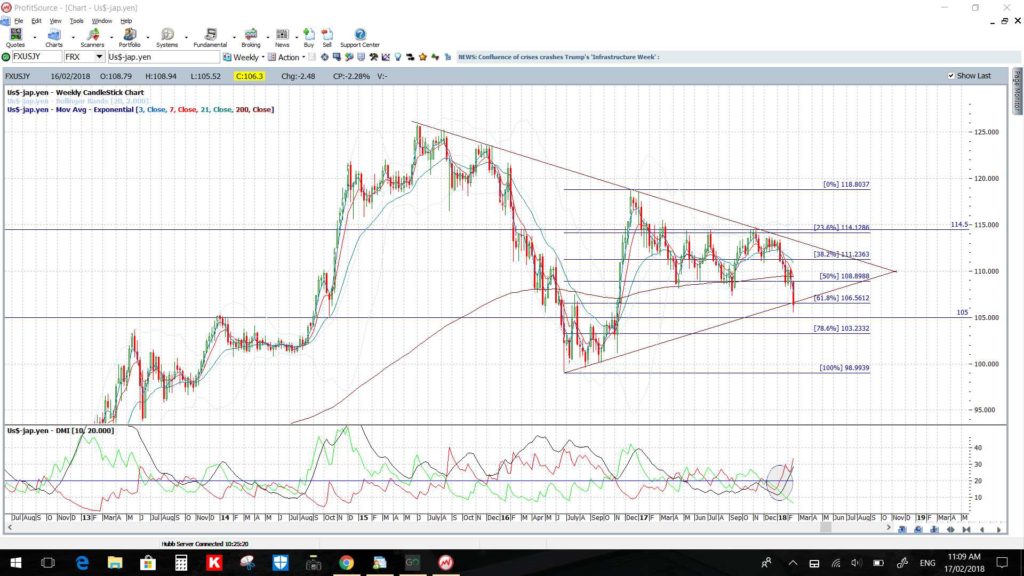
USD/JPY: This gave a great trend line breakout and TC signal last week but price action paused at the weekly charts support triangle trend line and weekly 61.8% fib level.
I’m watching for any potential test of the 110 S/R level here as I note it is the 4hr chart’s 61.8% fib.
- Watch the trend lines for any new breakout:
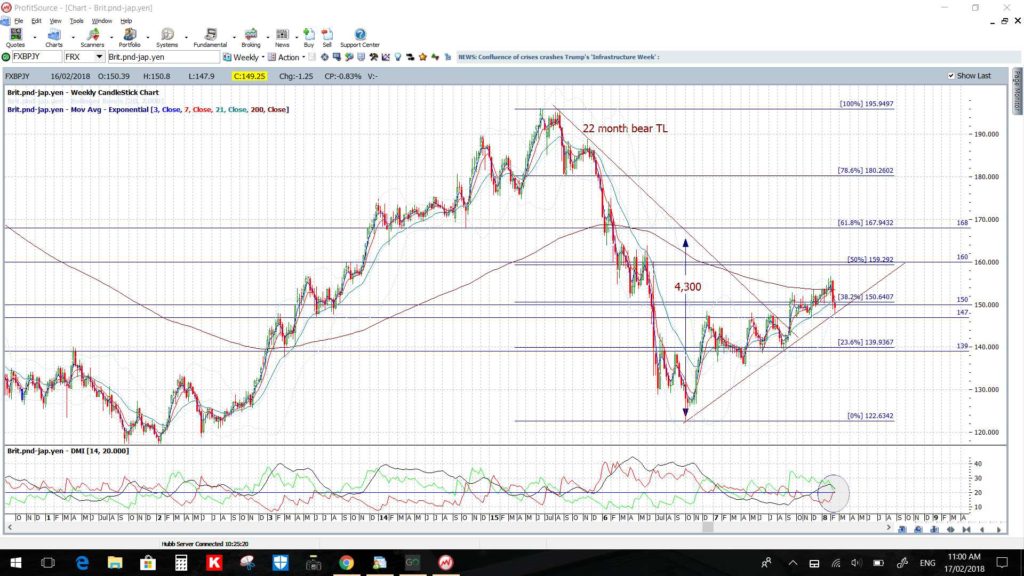
GBP/JPY: Like with the other Yen pairs, I’m watching for any relief rally here to test the weekly 200 EMA level here as I note it is the 4hr chart’s 61.8% fib.
Any break lower would have me looking to the 147 S/R level.
- Watch the 4hr chart trend lines for any new breakout.
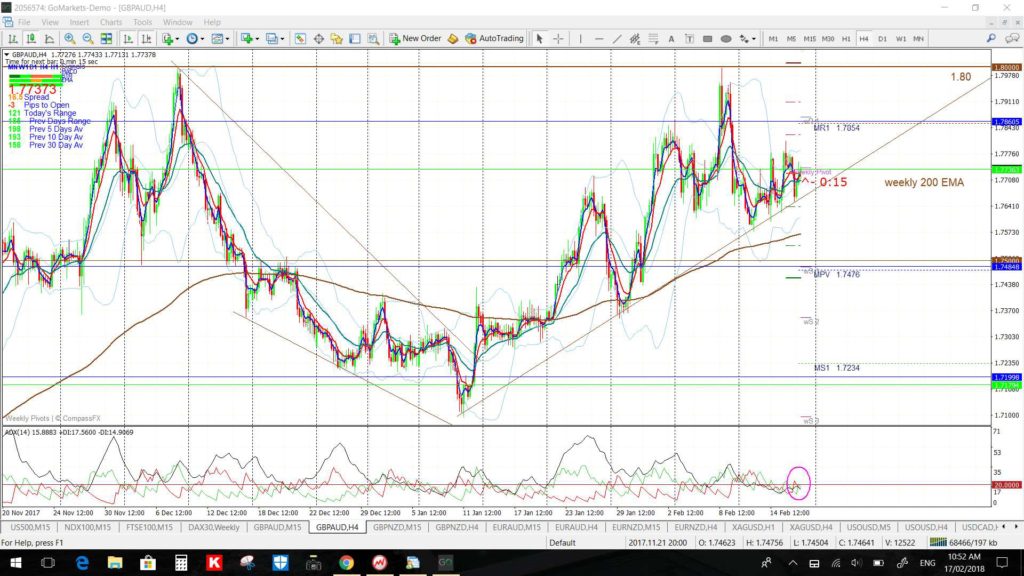
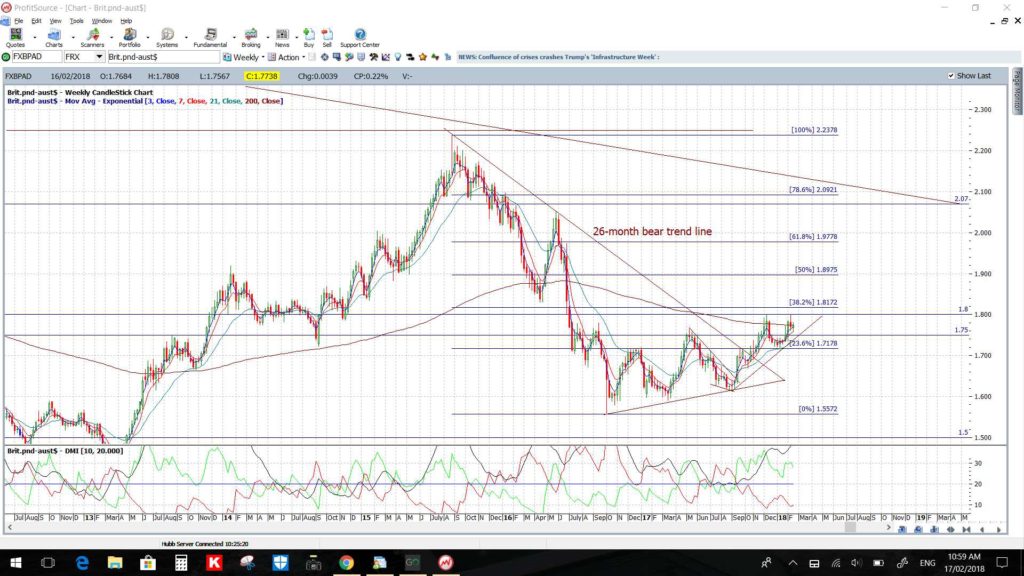
GBP/AUD: Not a lot has changed here this week with 1.80 and the weekly 200 EMA still in focus.
- Watch the 4hr chart’s triangle trend lines, weekly 200 EMA and 1.80 for any new breakout:
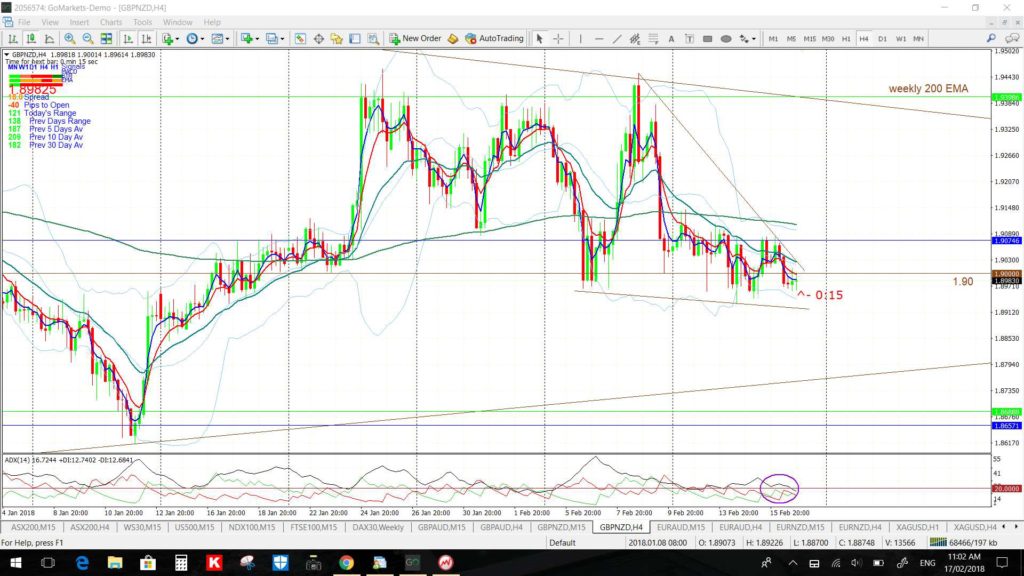
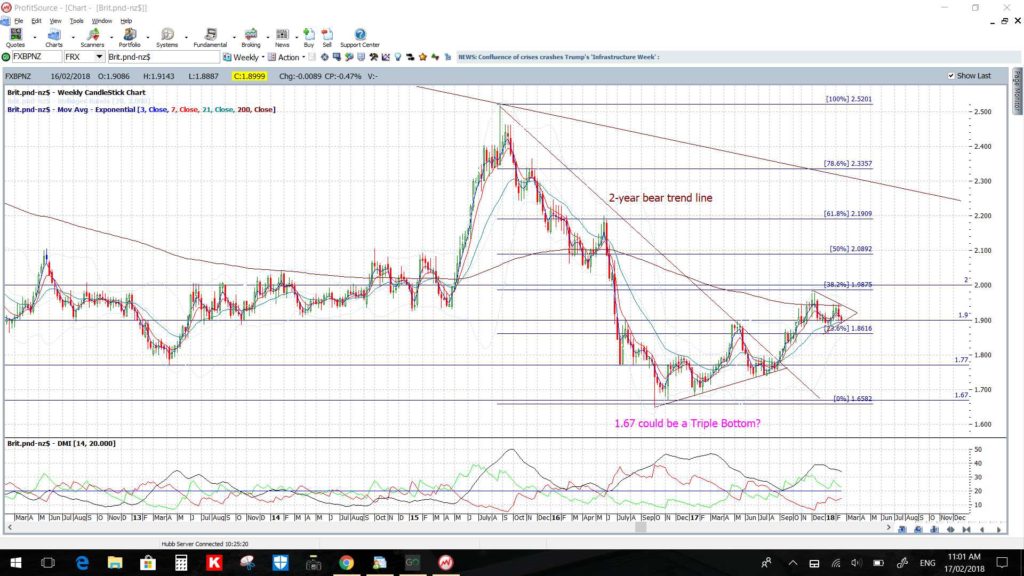
GBP/NZD: A bit clearer here this week but with 1.90 S/R still in focus.
- Watch the wedge trend lines and 1.90 level for any new breakout:
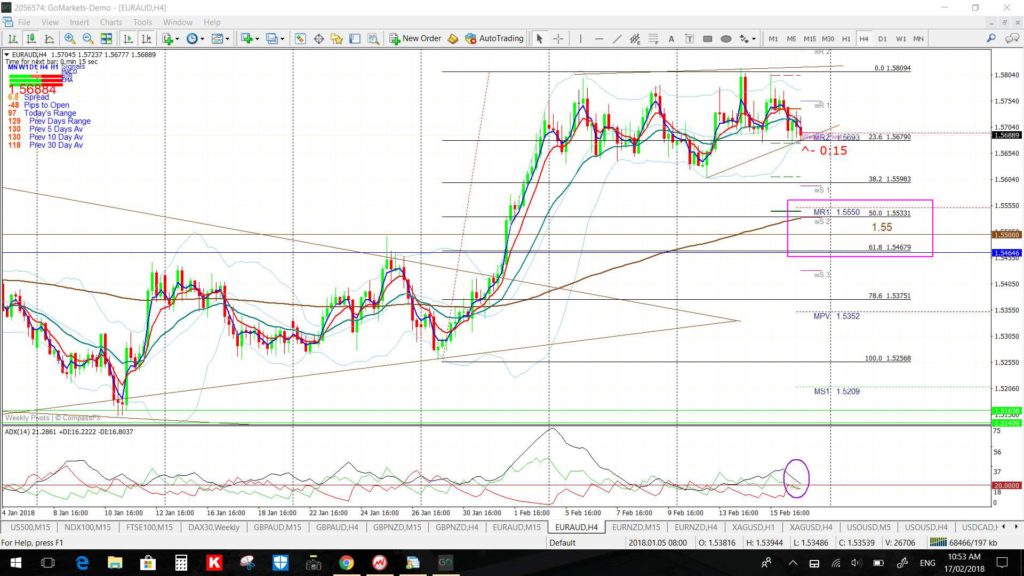
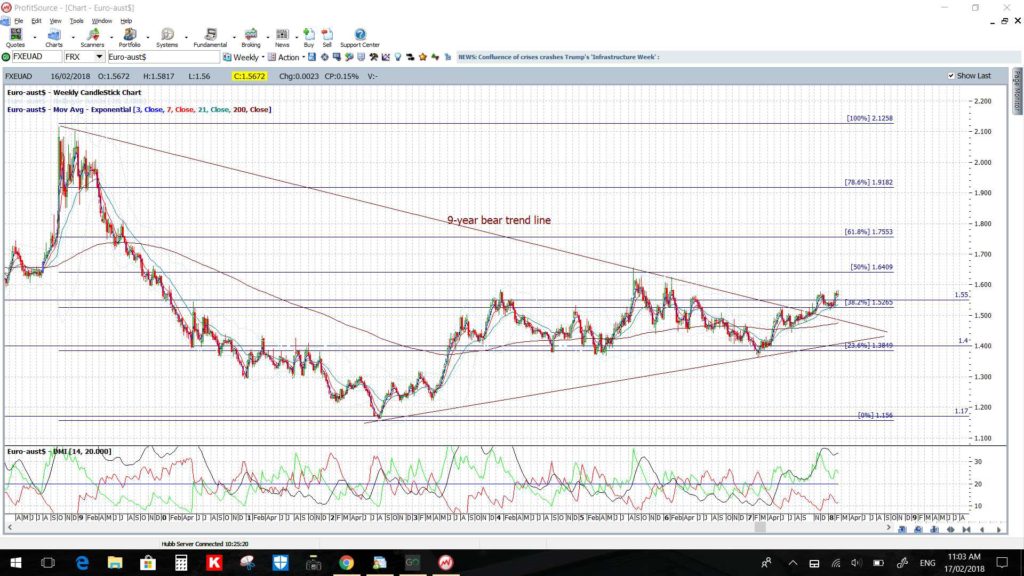
EUR/AUD: Still looking a bit Bull Flag like here as price consolidates back above the 1.55 level.
Any pullback would have me looking for a test of 1.55 S/R.
- Watch the 4hr chart’s Flag trend lines for any new breakout:
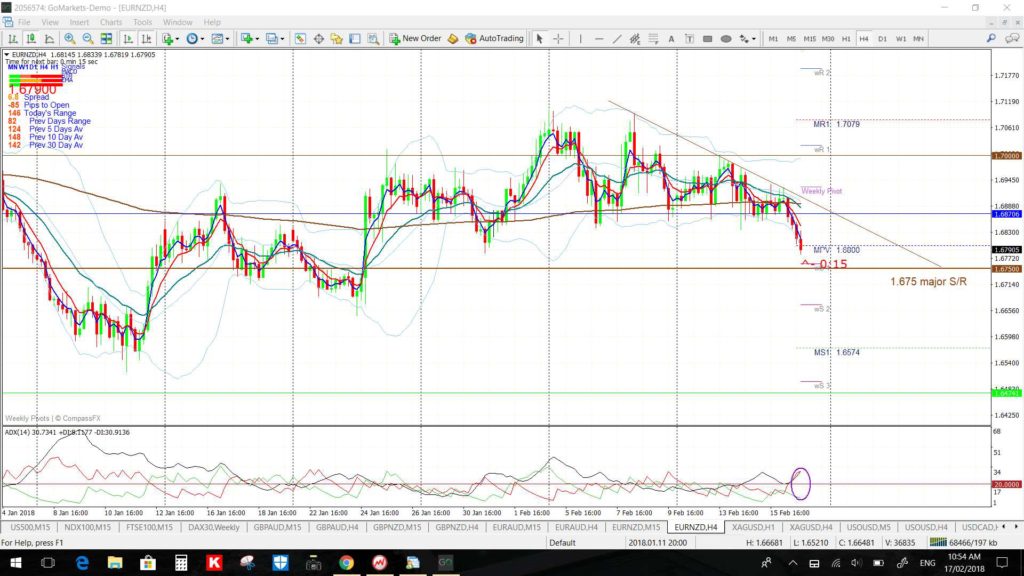
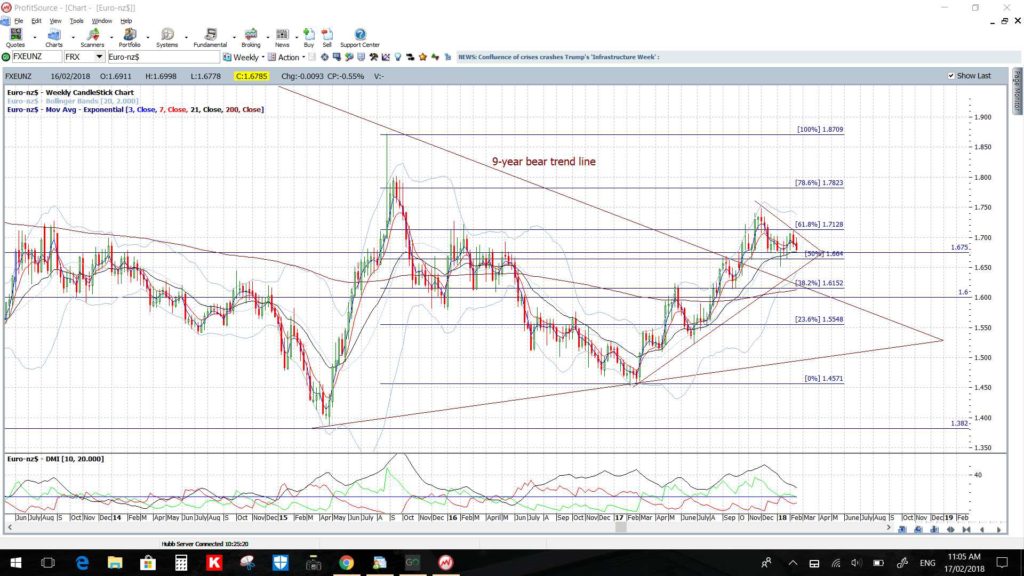
EUR/NZD: This continues to consolidate above the key 1.675 level.
- Watch the 4hr chart’s triangle trend lines for any new breakout:
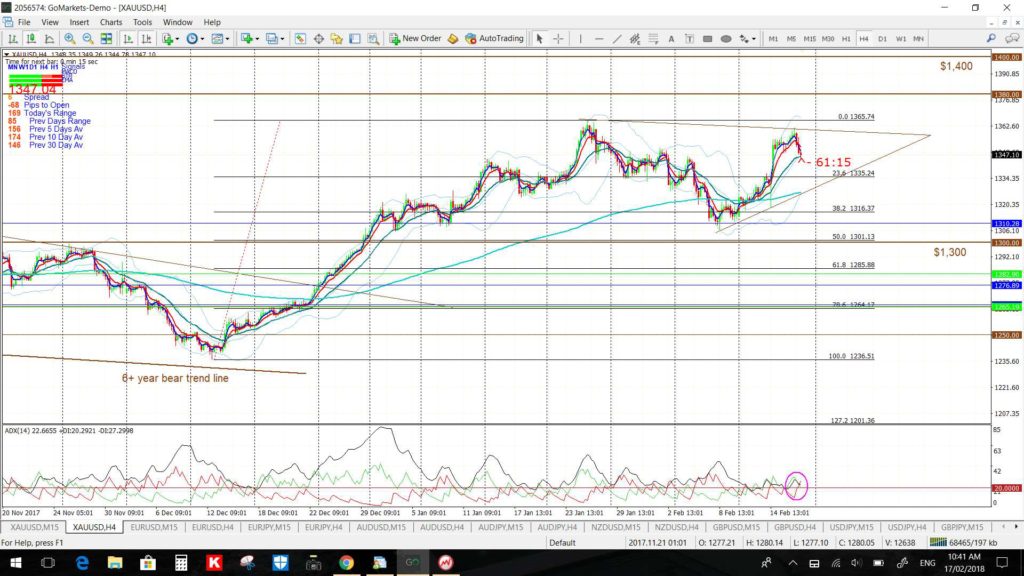
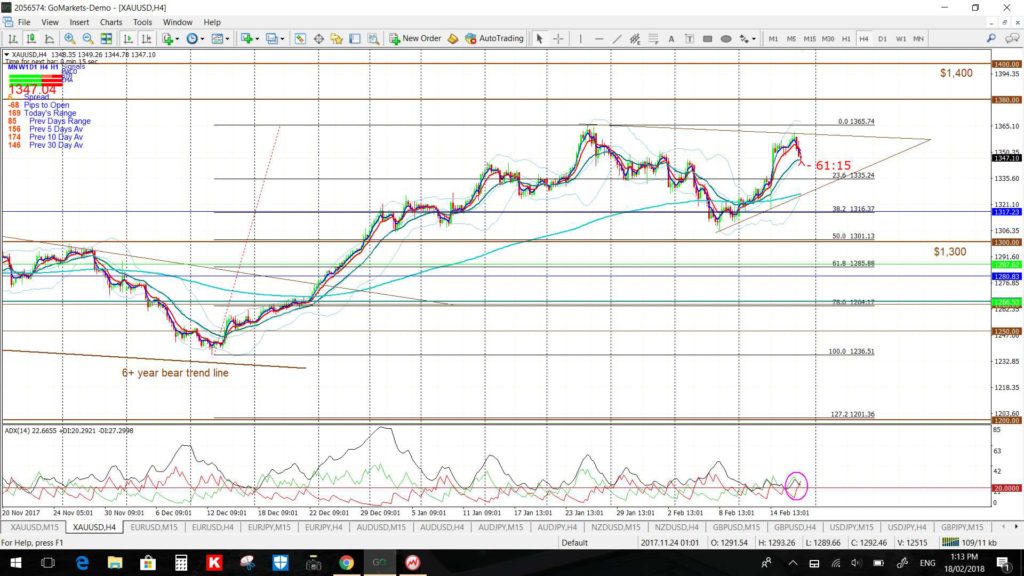
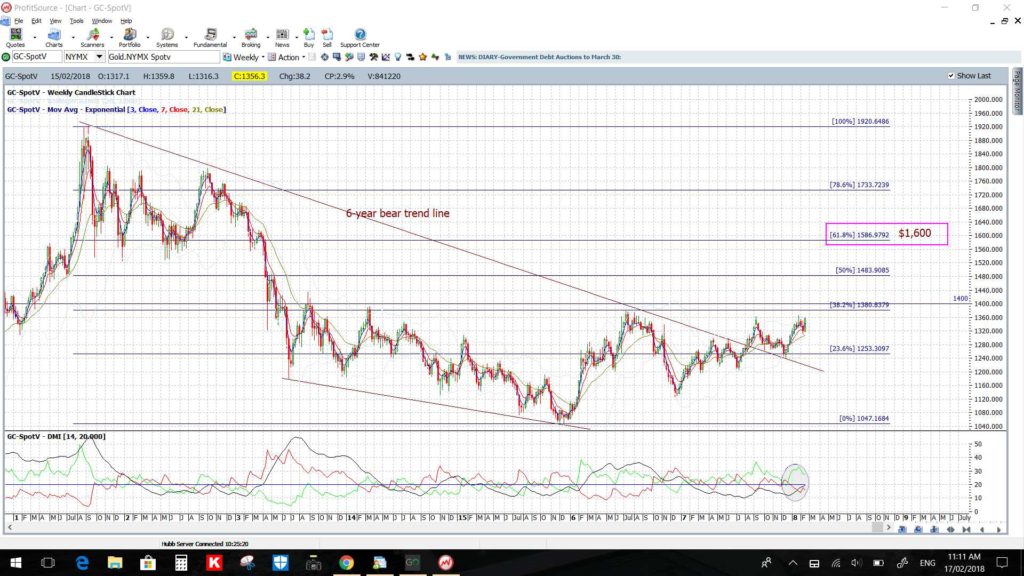
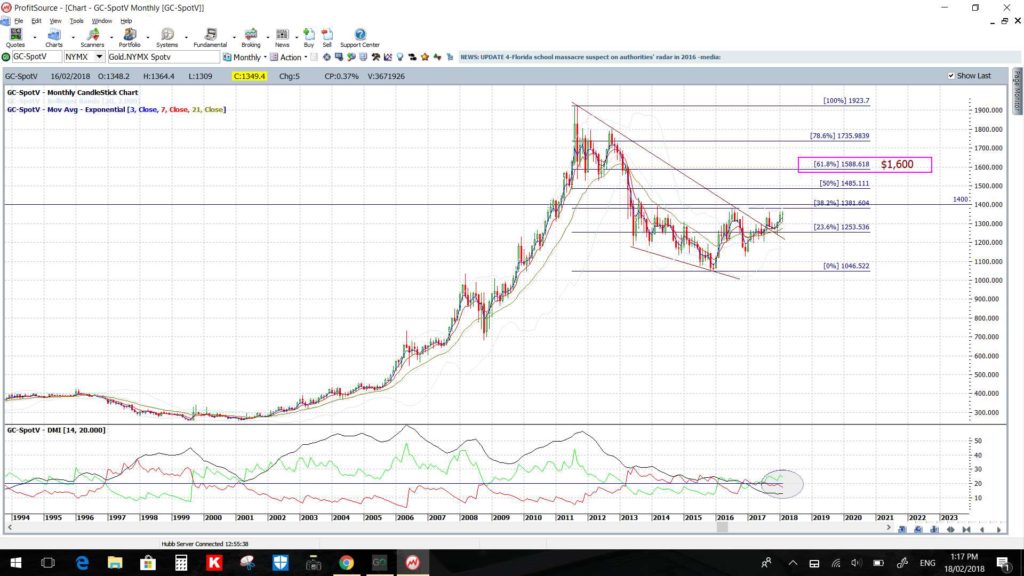
Gold: Gold pushed higher last week and this has brought the $1,400 level back into focus. The $1,400 level is just 550 pips away from current price so any test of this region is worth stalking so as to try and capture some of the run. I note that any bullish breakout and move above $1,400 would support the Bull Flag seen on the monthly chart.
Any bearish retreat would have me looking for a test of $1,300 as this is near the 4hr chart’s 50% fib and, after that, the 4hr chart’s 61.8% fib which is also near the daily 200 EMA.
- Watch the 4hr chart’s triangle trend lines for any new breakout:
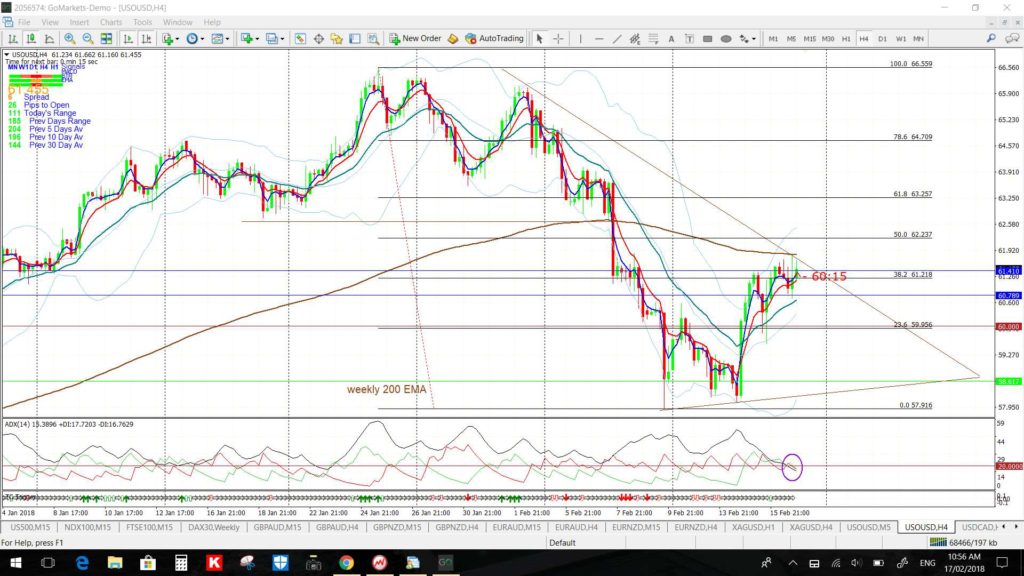
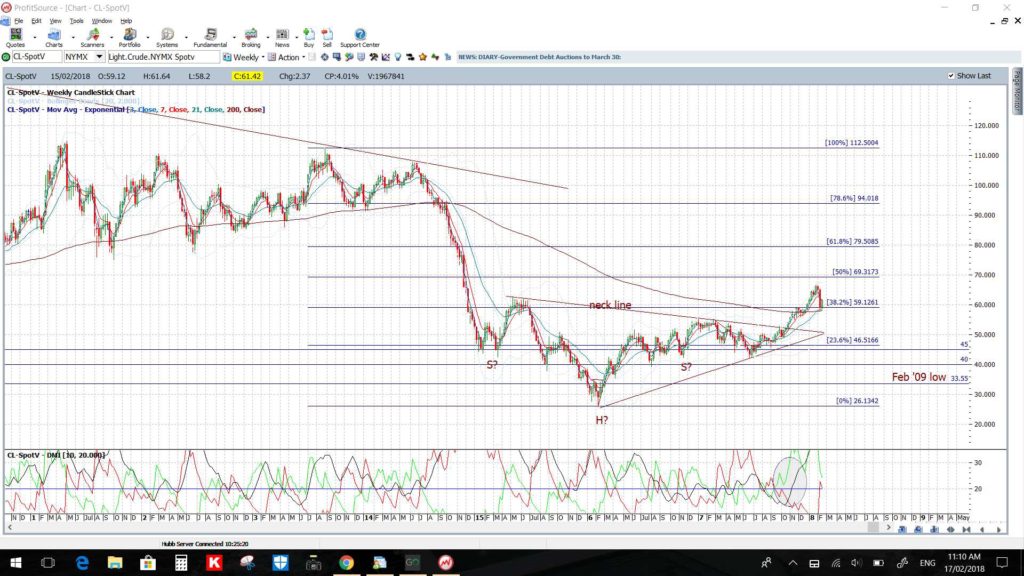
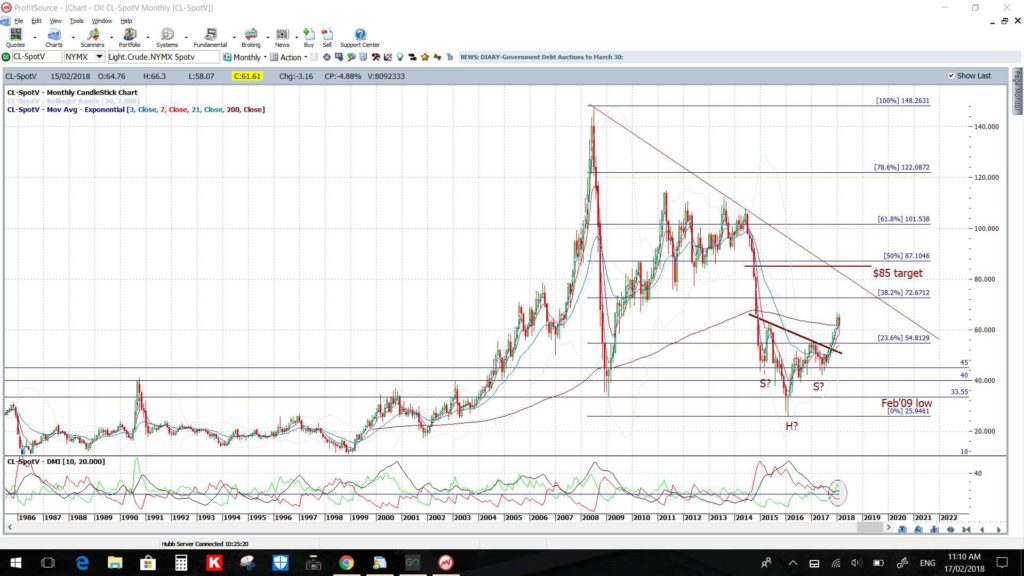
Oil: Oil continues to consolidate near the weekly 200 EMA. The monthly chart shows the monthly 200 EMA is nearby too.
- Watch the 4hr chart’s triangle trend lines for any new breakout.

