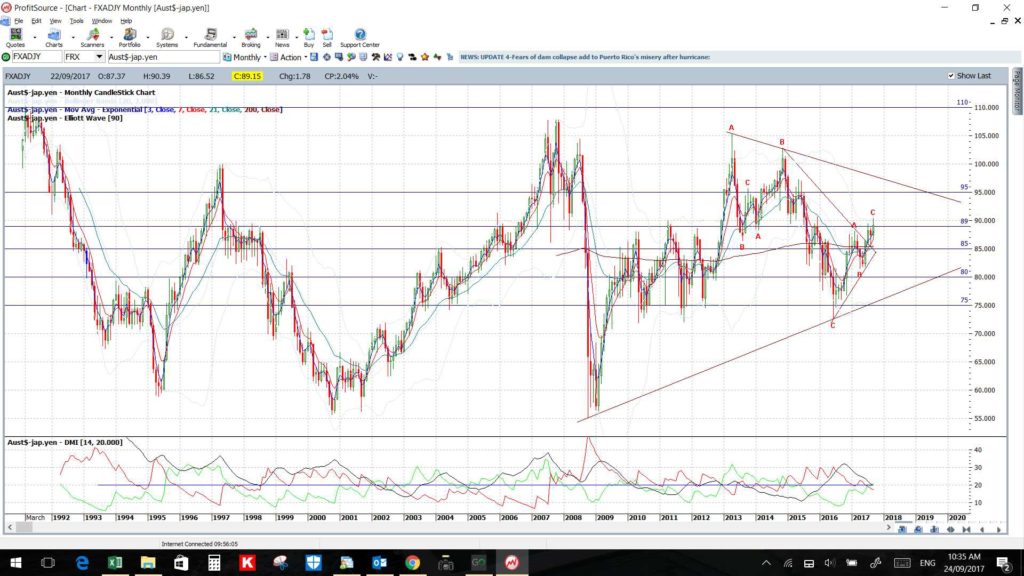
Last week: There were a number of trend line breakouts last week but the moves were choppy. Whilst last week’s FOMC and / or this weekend’s German Election may be feeding into this uncertainty I also note many FX pairs are at MAJOR monthly-chart based S/R levels. These strongly respected Support and Resistance levels may continue to play havoc with the charts until they are either decisively respected or rejected.
Major FX levels: The following FX pairs are sitting near these significant S/R levels. Check the monthly charts, included for most pairs in this update, for the significance of these major levels and…..make sure you remember this…..
- AUD/JPY: 89
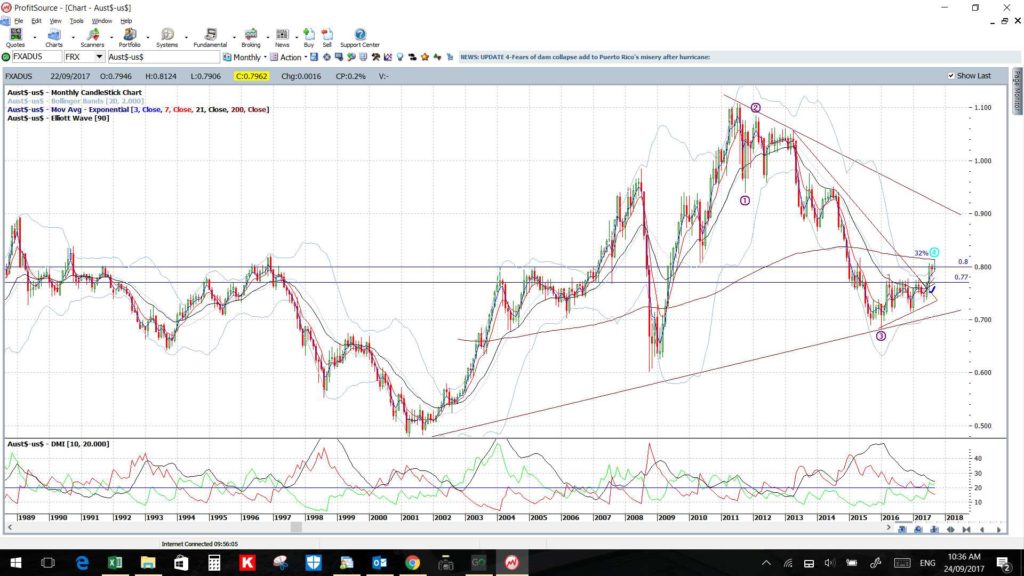
- AUD/USD: 0.80
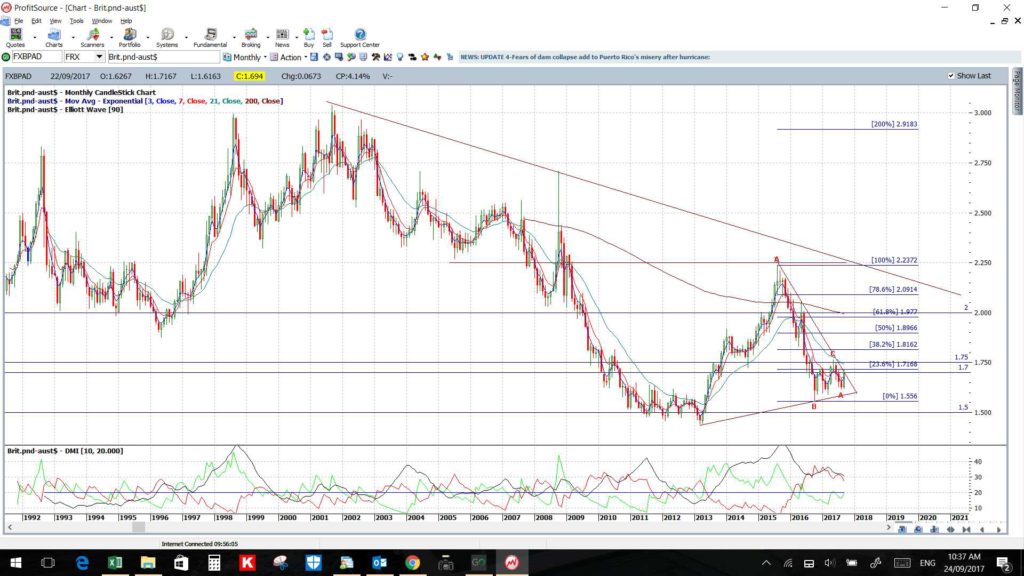
- GBP/AUD: 1.70
- GBP/JPY: 150
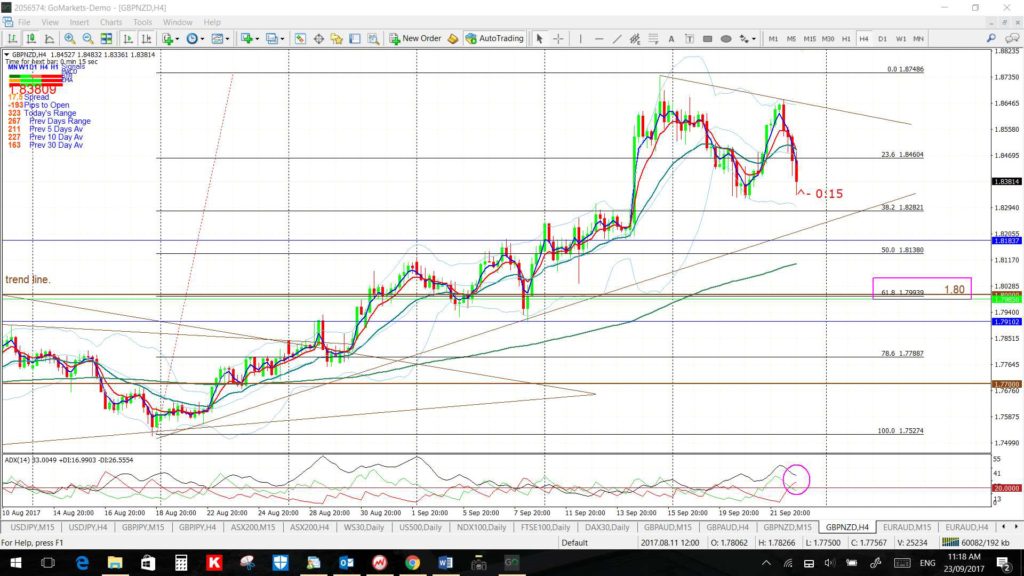
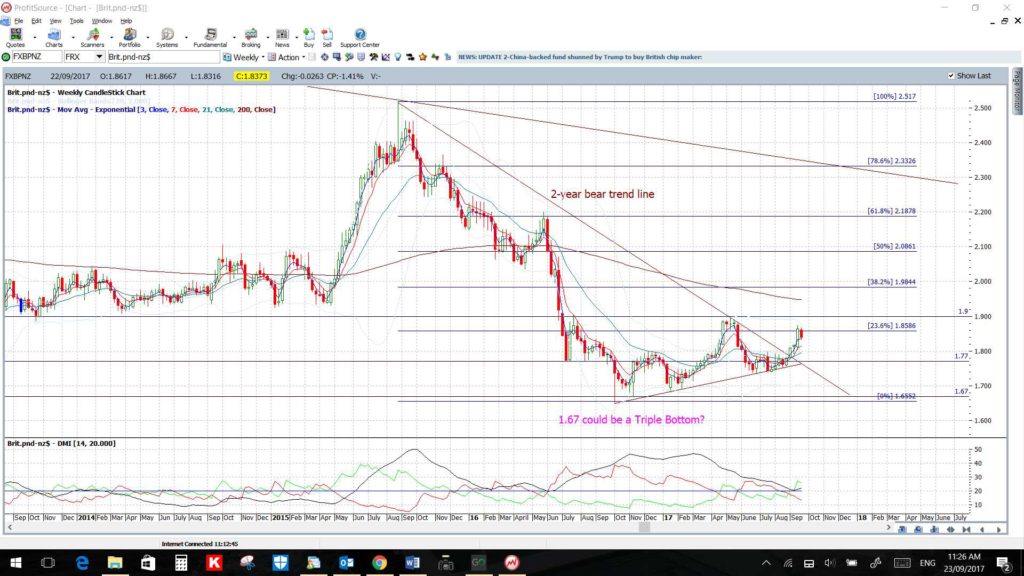
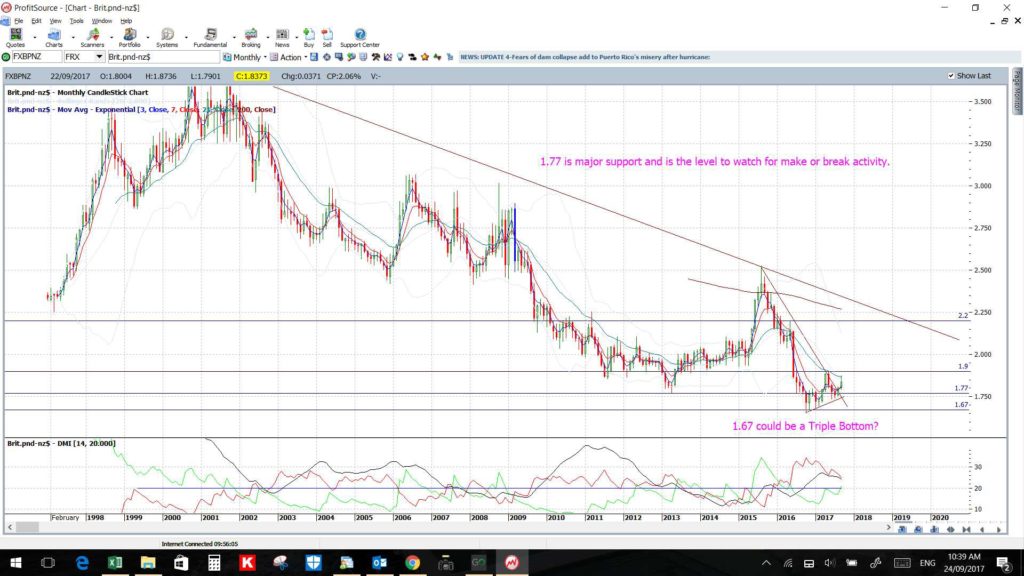
- GBP/NZD: 1.90
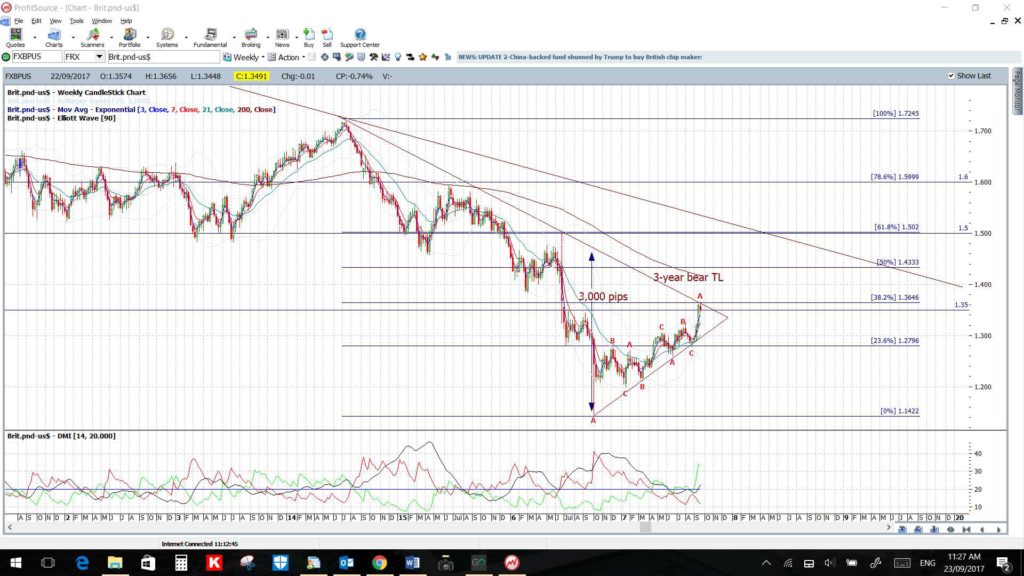
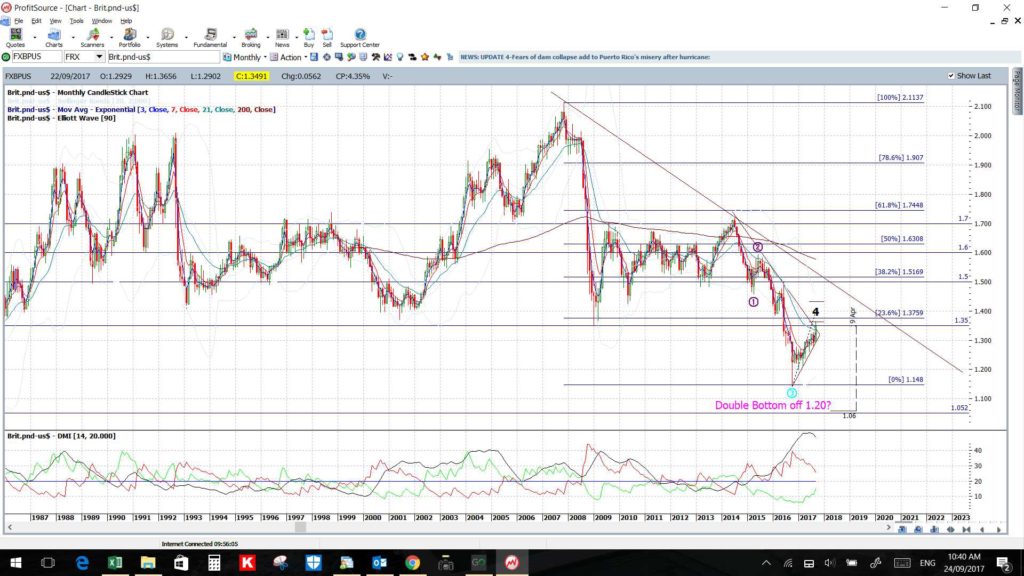
- GBP/USD: 1.35 and a 3-year bear trend line
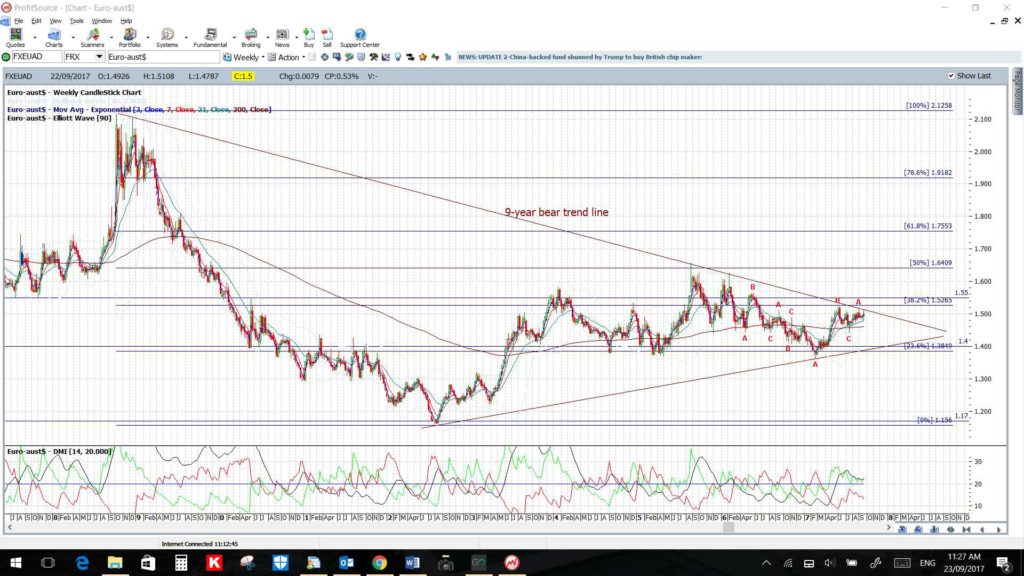
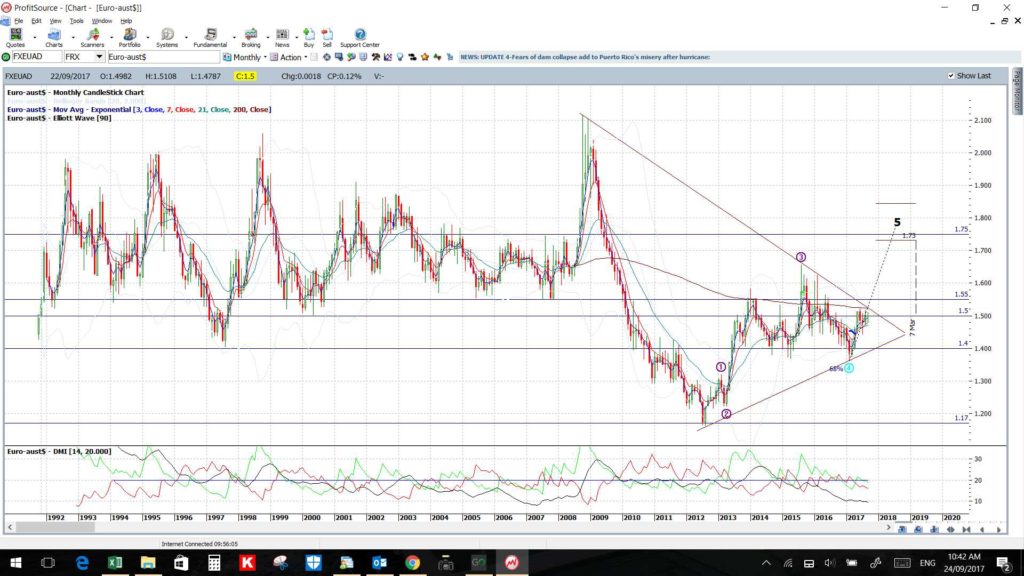
- EUR/AUD: a 9-year bear trend line
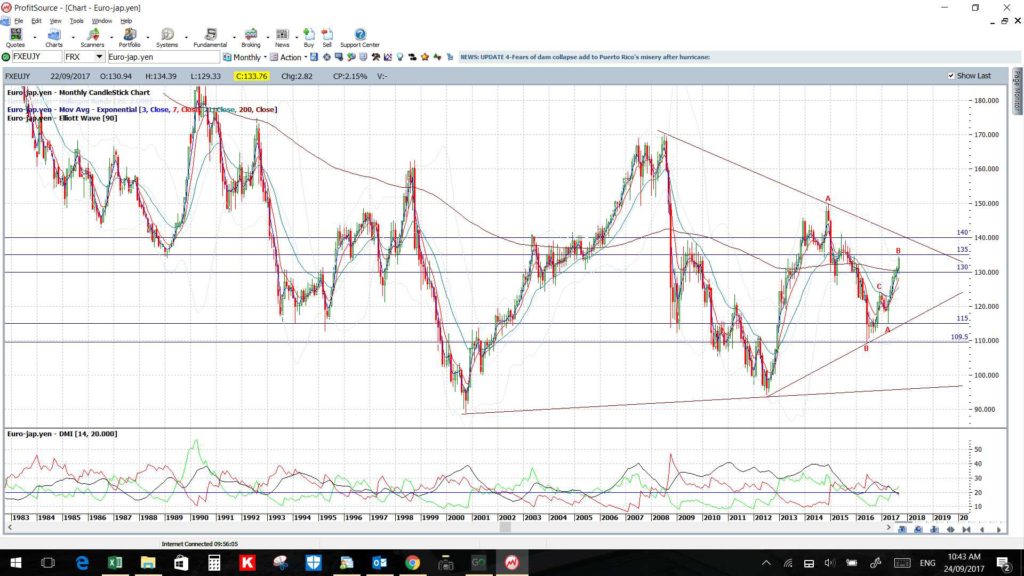
- EUR/JPY: 135 and this is also the weekly 61.8% fib
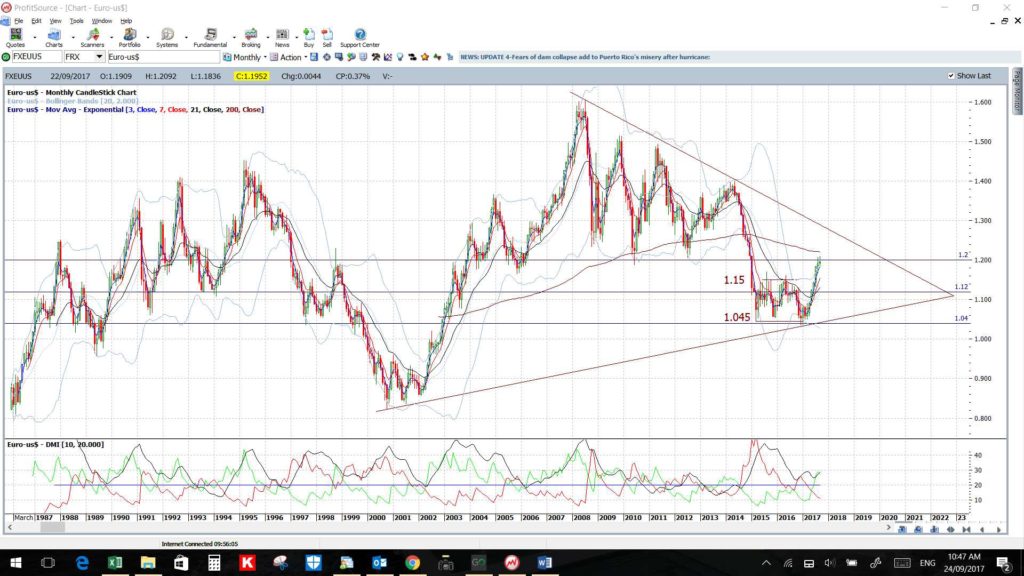
- EUR/USD: 1.20
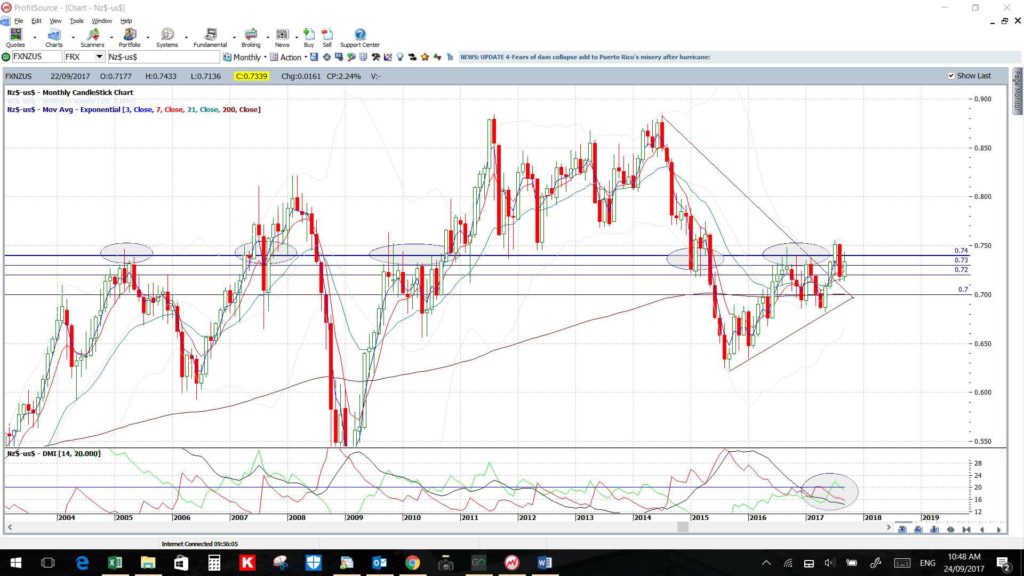
- NZD/USD: 0.74
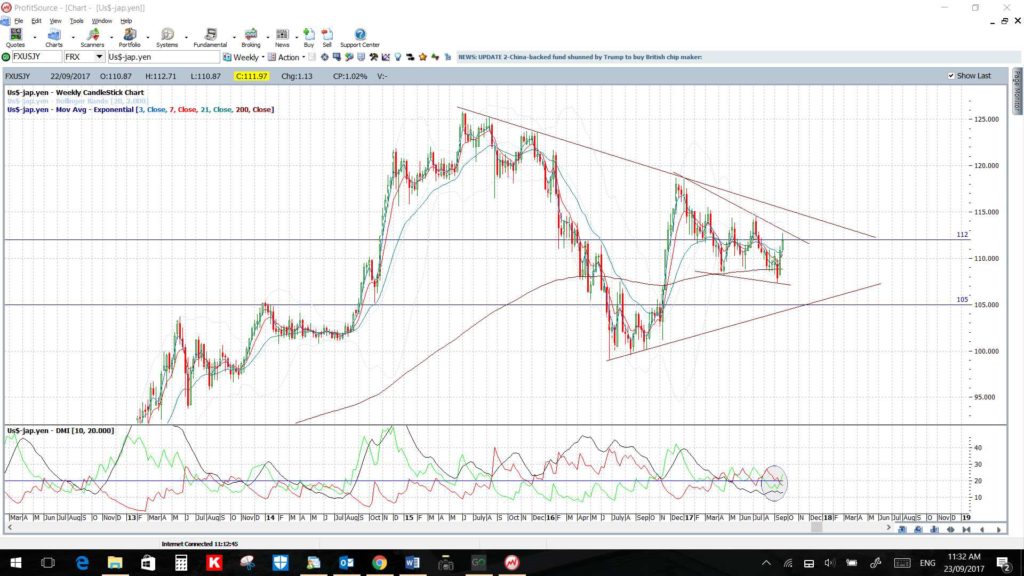
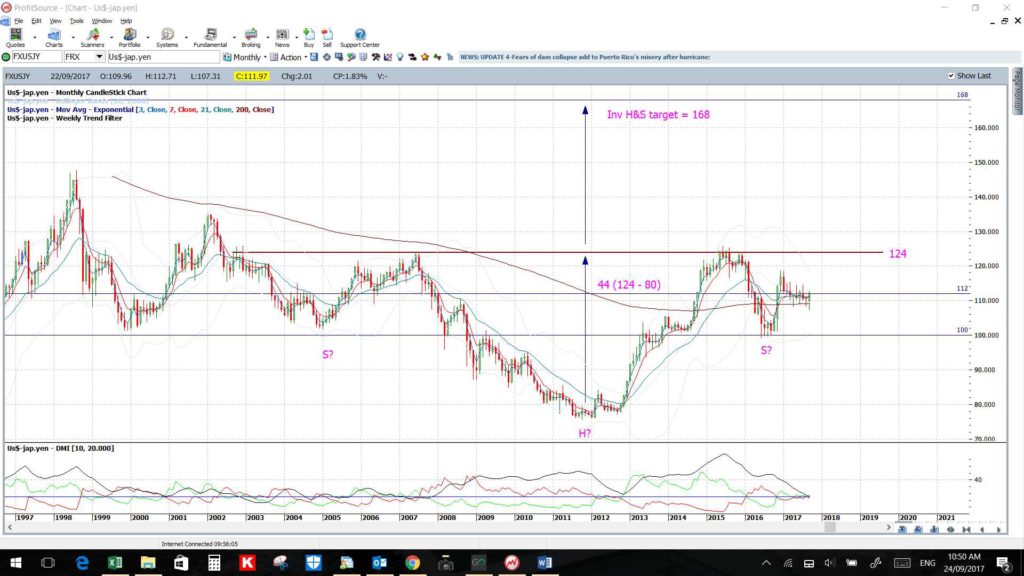
- USD/JPY: 112
- AUD/NZD: 1.10
- EUR/GBP: 0.89
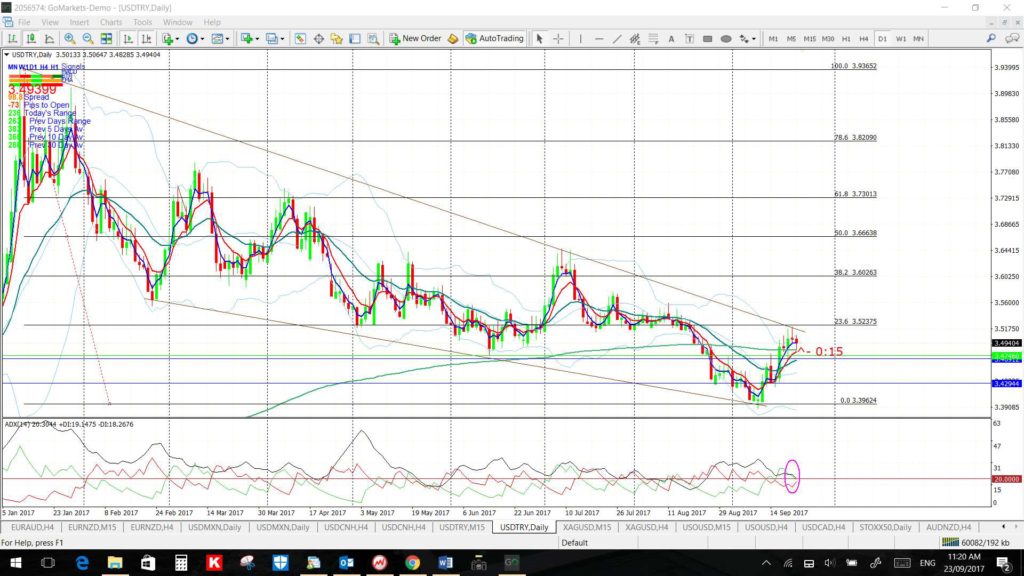
- USD/TRY: a 9-month bear trend line
- Gold: $1,300
- Oil: $50
Trend line breakout tally: these trades gave the following maximum pip movement and were profiled mid-week here, here, here and here:
- Gold: 140 pips.
- EUR/JPY: 130 pips.
- USD/JPY: 150 pips.
- AUD/JPY: 130 pips.
- AUD/USD: 90 pips.
- NZD/USD: 100 pips.
- USD/TRY: 750 pips.
- GBP/JPY: 160 pips.
- GBP/AUD: 200 pips.
- GBP/NZD: 100 pips.
This week:
- US$: the US$ index closed with a bullish coloured ‘Spinning Top’ candle but still below the key 92.50 S/R zone. A review of the FX Indices can be found through this link.
- Data: There is one Central Bank update with the RBNZ (NZD). There are also two elections to monitor: the NZD Parliamentary Election (Saturday) and the GER Federal Election (Sunday). There is high impact CNY data released next Saturday, after the week closes, so watch for impact before the next weekly open (that is, on Monday 2nd October).
- Month & Quarter close: both of these close at the end of the coming week
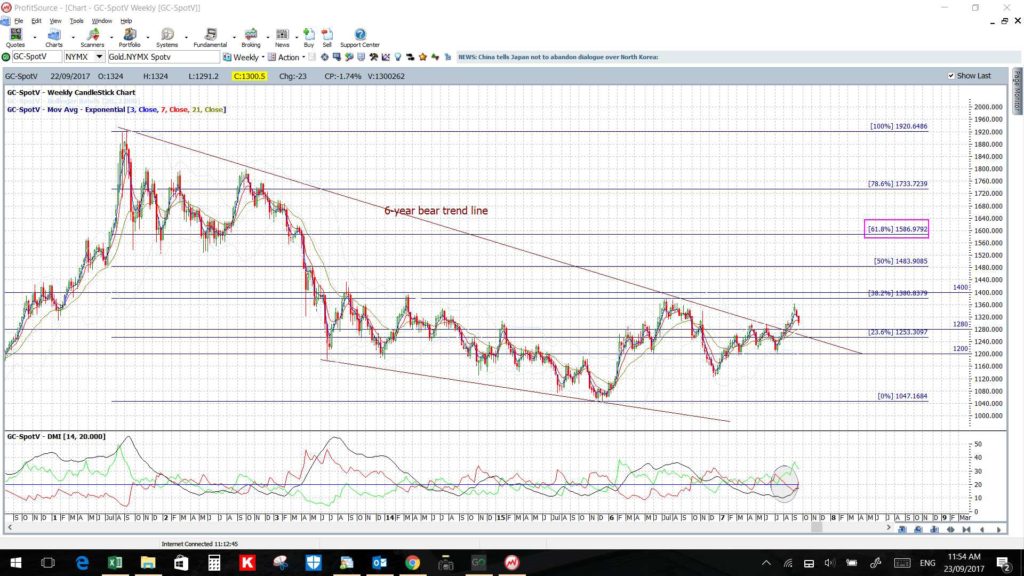
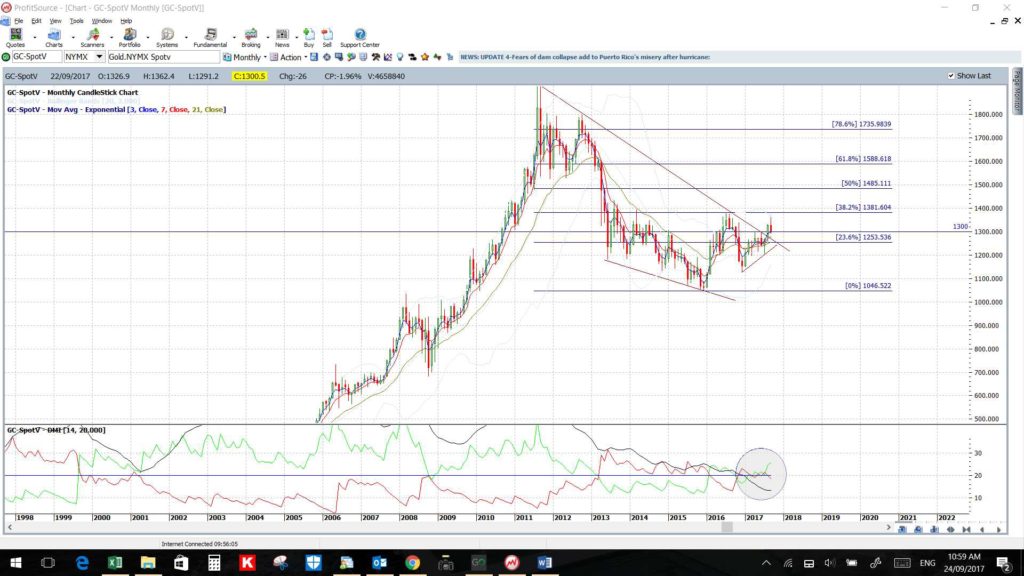
- Gold: printed another bearish weekly candle BUT continues holding above the recently broken 6-year bear trend line. I am still watching for any continuation move up to the weekly chart’s 61.8% fib; circa $1,600.
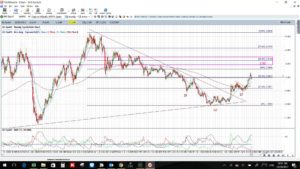
- Copper: has pulled back a bit but this week’s bullish coloured Doji/Spinning Top could be read as a bullish-reversal Hammer candle:
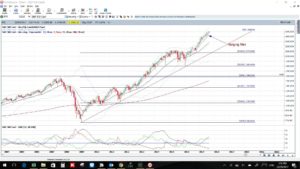
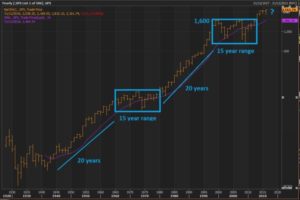
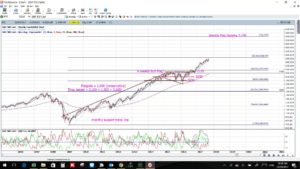
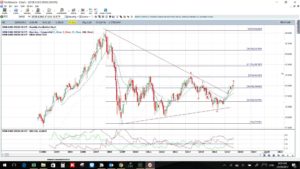
- S&P500: I’m still keeping an open mind with the S&P500. Any pullback would have me looking towards the top of the previous channel breakout circa 1,600 (see S&P500 Yearly chart). This is the level I believe will form up the base of the next trading range for the index. I am bullish over the longer term but trends do not travel in straight lines forever. The 1,600 level currently marks the 50% fib of the recent swing-high move but, perhaps, the current trend might continue until such time that it marks the 61.8% fib. It is worth noting at this point that the weekly chart is presenting with a Bull Flag pattern and, if you add Fibonacci retracement to this chart and the projected target for this move, the 61.8% Fib kicks in at the 1,600 S/R breakout level. How’s that for confluence! For the time being though, let the trend be your friend…until it isn’t!:
S&P500 monthly
S&P500 yearly
S&P500 weekly: showing Bull Flag projection:
- FEZ: still looking bullish:
- NB: I depart for a one month holiday to the USA this Friday 29th so there will be few trading updates during this period.
Calendar:
- Sat 23rd: NZD Parliamentary Elections.
- Sun 24th: NZD Daylight Saving Shift. EUR German Federal Elections.
- Mon 25th: BoJ Gov Kuroda speech. EUR ECB President Draghi speech.
- Tue 26th: NZD Trade Balance. GBP Inflation Report Hearings. USD CB Consumer Confidence. USD Fed Chair Yellen speech.
- Wed 27th: USD Core Durable Goods & Oil Inventories. CAD BoC Gov Poloz speech.
- Thurs 28th: NZD RBNZ Rate Update. USD Final GDP & Weekly Unemployment Claims. BoJ Gov Kuroda speech. GBP BoE Gov Carney speech.
- Fri 29th: CNY Caixin Manufacturing PMI. GBP Current Account. CAD GDP. EUR ECB President Draghi speech. GBP BoE Gov Carney speech.
- Sat 30th: CNY Manufacturing and Non-Manufacturing PMI.
Forex:
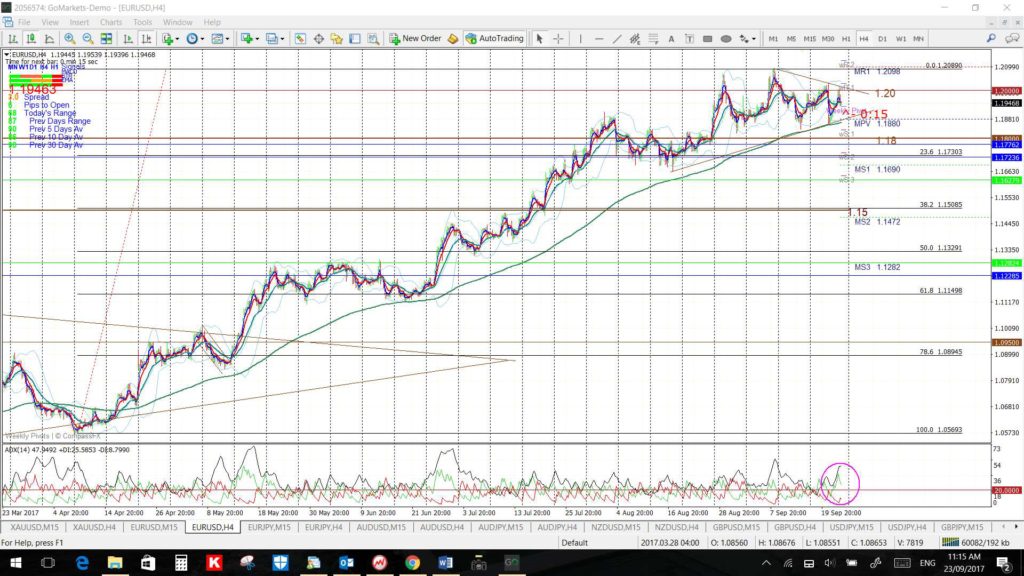
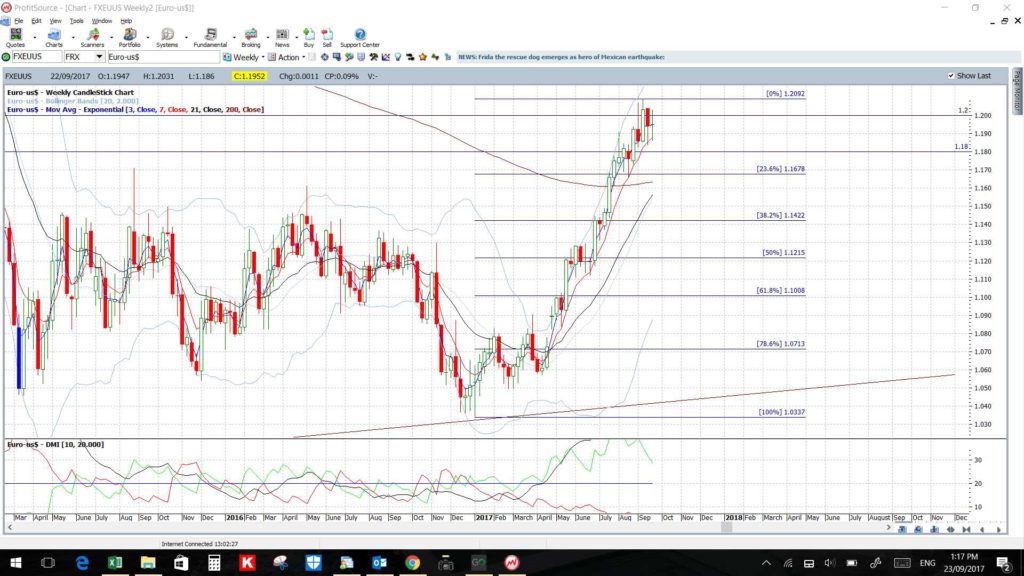
EUR/USD: The EUR/USD spent another week, the 4th such week, consolidating above 1.18 but below 1.20 and closed the week with an indecision-style Doji candle, hardly surprising given the weekend German Election!
Check the monthly chart to see how important this whole-number 1.20 resistance zone is and this will be the level to watch in coming sessions.
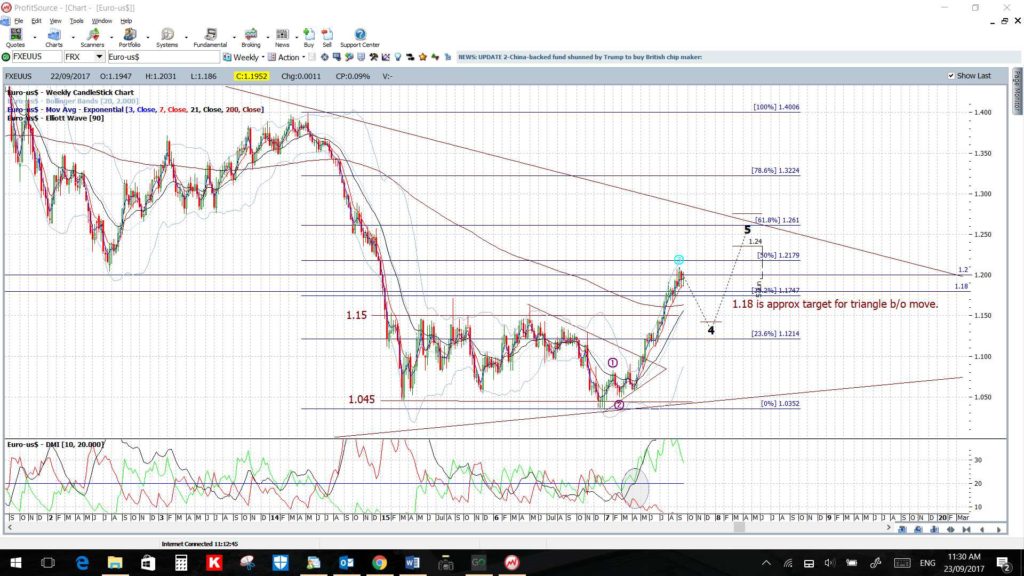
Recall: Just as the US$ index has been in a downtrend since the start of the year, the EUR/USD has rallied. Trends do not travel in straight lines forever though and, even if this pair is set to continue higher, a pause or pullback could occur before that ultimate move. Given this pair has peaked at the major S/R level of 1.20, a level it hasn’t traded above since January 2015, this could be the resistance to help bring about a pause or pullback. I note, on one of the weekly charts below, that the 61.8% fib of this 2017 swing high move is down near 1.10 so that would be a target for any sustained pause here.
Watch the 4hr chart triangle and 1.20 level for any new breakout:
- Upper targets: any bullish breakout will bring the longer-term weekly chart’s 61.8% fib, up near 1.25, into focus.
- Lower targets: any bearish retreat would have me looking for a test of 1.18 and then the 1.15 S/R level. The 4hr chart’s 61.8% fib is then down near 1.115.
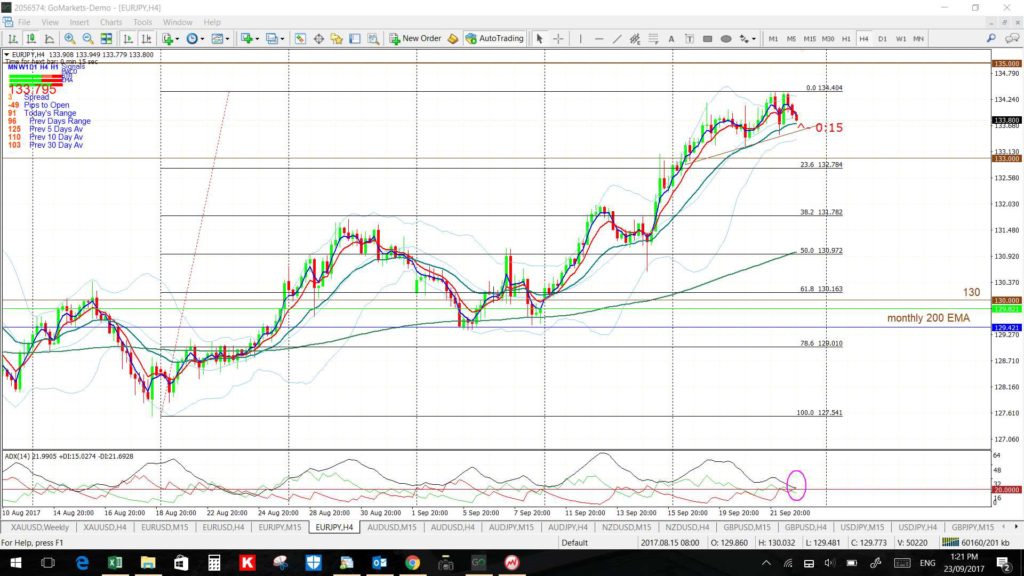
EUR/JPY: The EUR/JPY has almost reached up to the major 135 S/R, which is the weekly chart’s 61.8% fib, and this level has been in my sights since the weekly triangle breakout. Price closed just below 134 but the major 135 is the one to watch in coming sessions for any new make or break.
NB: There is a still a weekly chart triangle breakout in progress here worth about 2,000 pips.
Watch the 134 and 135 levels for any new make or break:
- Upper targets: any bullish breakout would have me looking for a test of the weekly chart’s 78.6% Fib, up near 140, as this is also the monthly chart’s 10-year bear trend line.
- Lower targets: any bearish breakdown would have me looking for a test of 133 and then 130, which is now the 4hr chart’s 61.8% Fib.
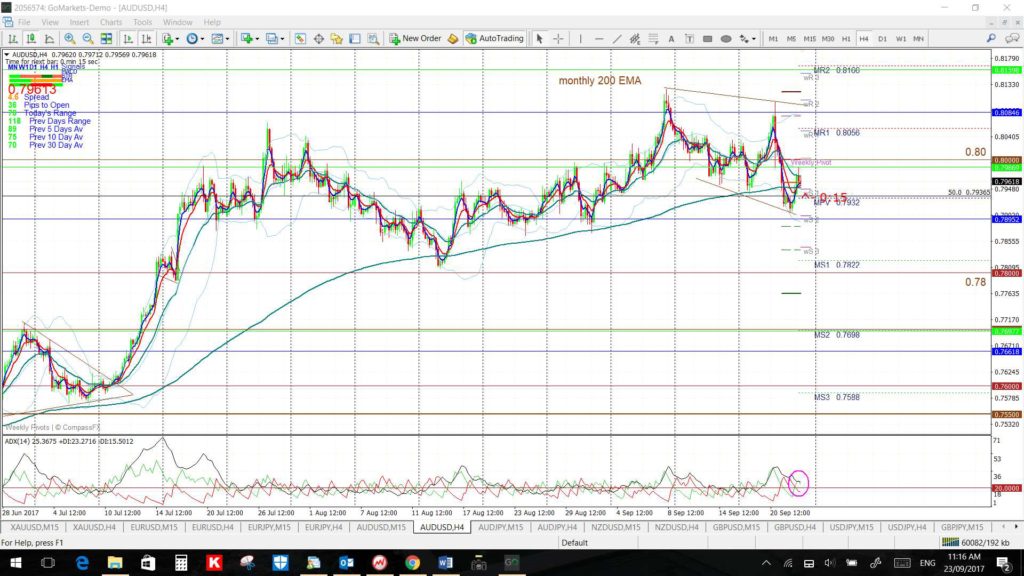
AUD/USD: The Aussie remains pegged near the key 0.80 level but closed the week just below this major S/R zone. The pace of rate hikes for the US versus Australia is helping to put pressure on the AUD and recent metal price weakness may have fed this pullback too.
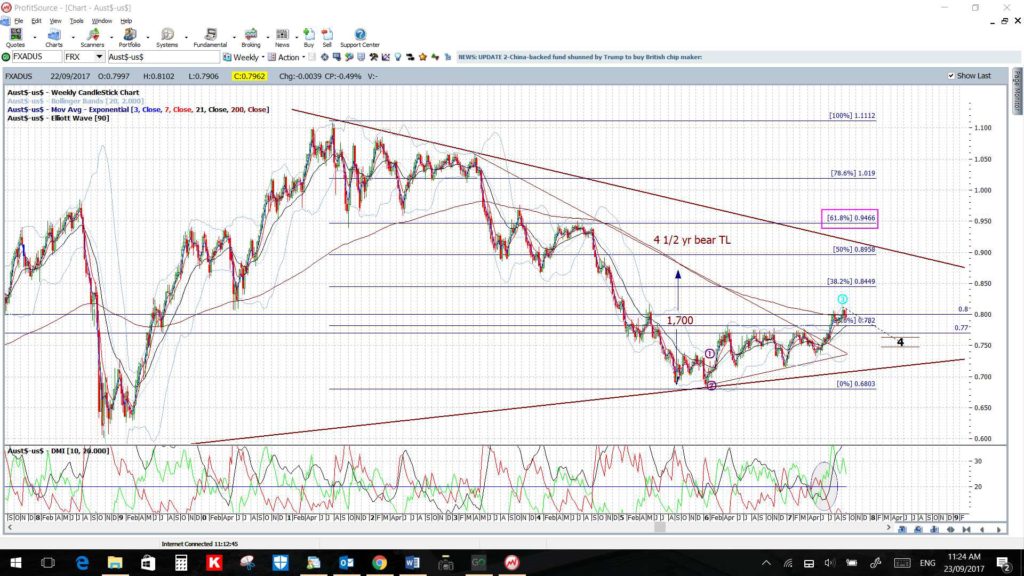
Recall: that the Aussie is currently in a weekly chart triangle breakout worth up to 1,700 pips and has given around 400 pips thus far.
Watch the revised wedge trend lines and key 0.80 level for any new make or break:
- Upper targets: any bullish break above 0.80 would bring other whole numbers followed by the weekly chart’s 50% fib, near 0.90, as this is now also near the monthly chart’s bear trend line.
- Lower targets: any pullback would have me looking for a test of 0.78.
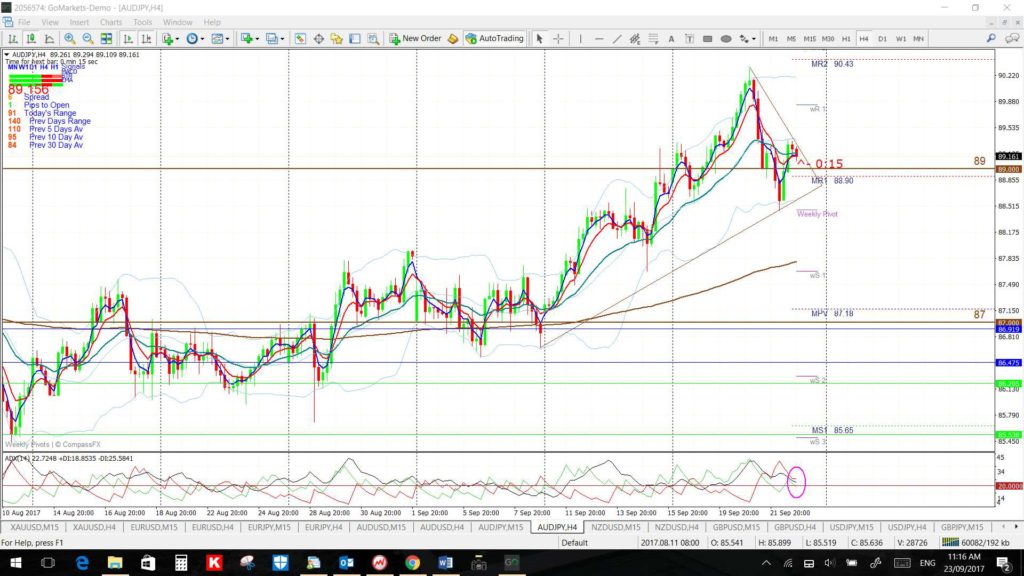
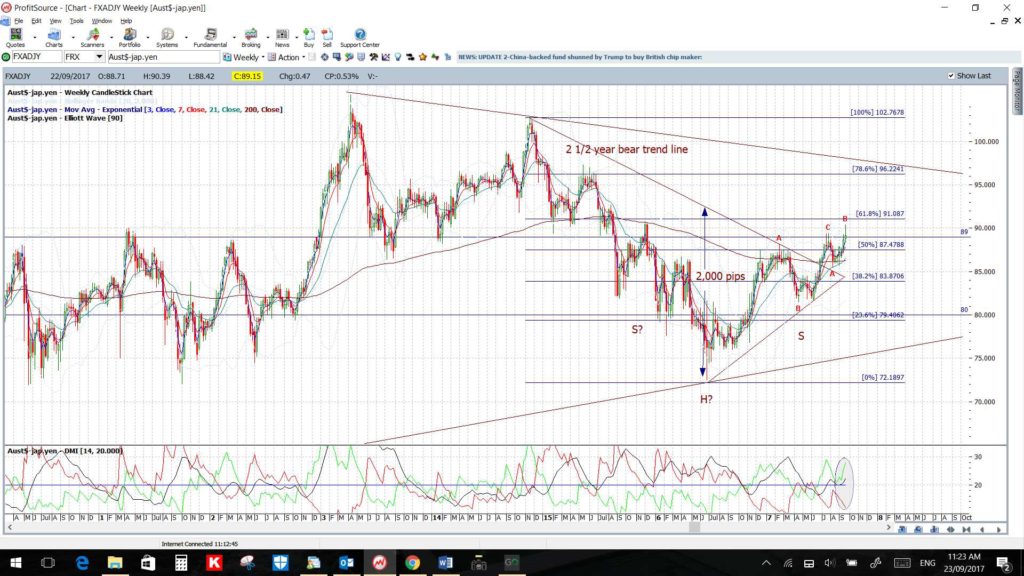
AUD/JPY: The AUD/JPY popped above the key 89 level last week and even managed to close out the week just above this major S/R level.
Recall: there is a weekly chart triangle breakout in progress here after the break of a 2 ½ year bear trend line and this could be worth up to 2,000 pips. Note, also, the bullish-reversal Inverse H&S on the weekly chart.
Watch the revised 4hr chart triangle and 89 level for any new breakout:
- Upper targets: any bullish breakout would bring the weekly chart’s 61.8% fib, near 91, into focus.
- Lower targets: any bearish breakdown would have me looking for a test of 87 and then 85 S/R.
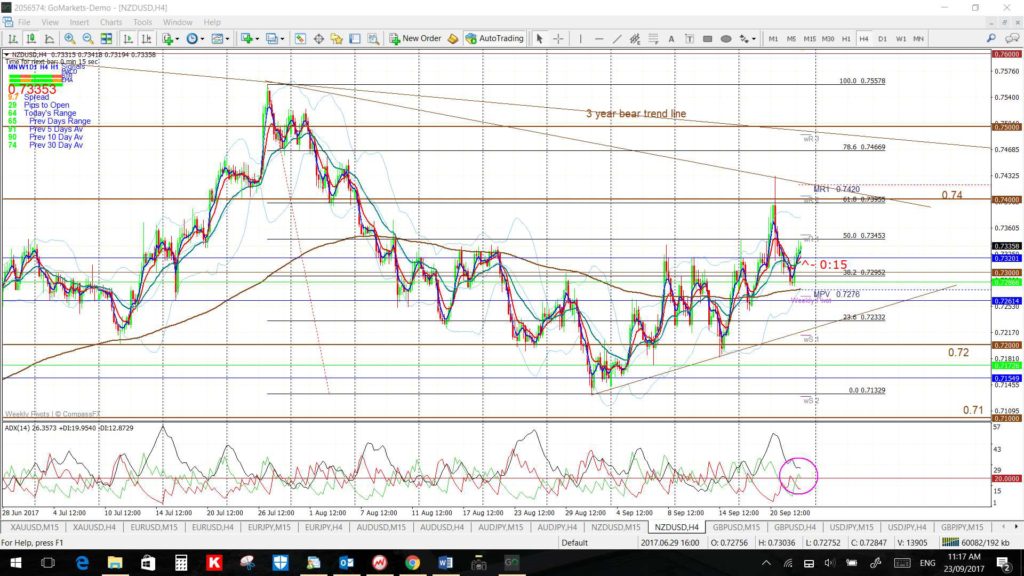
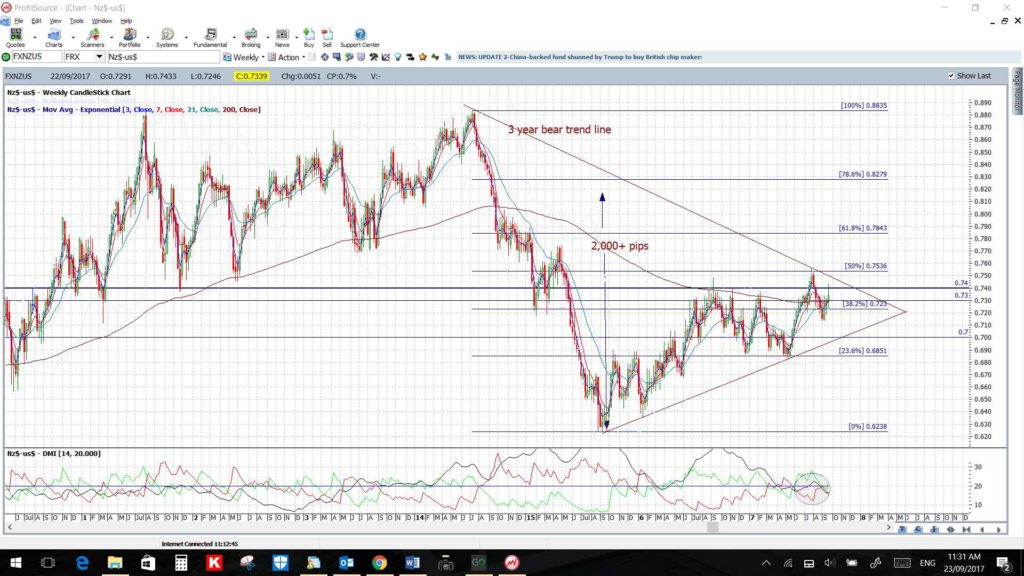
NZD/USD: The Kiwi remains in a revised 4hr chart triangle that is set within the larger weekly chart triangle. Note how the 61.8% fib, which tied in with the key 0.74 level, kept this pair pegged last week!
Watch on Thursday for impact from the RBNZ rate update.
Note: that there is a weekly chart triangle developing here that could be worth up to 2,000 pips.
Watch the 4hr chart triangle and 0.74 level for any new breakout:
- Upper targets: the longer-term weekly chart’s 50% fib, up near 0.75, and then the 61.8% fib, up near 0.79.
- Lower targets: The 0.72 then 0.71 and 0.70 S/R levels.
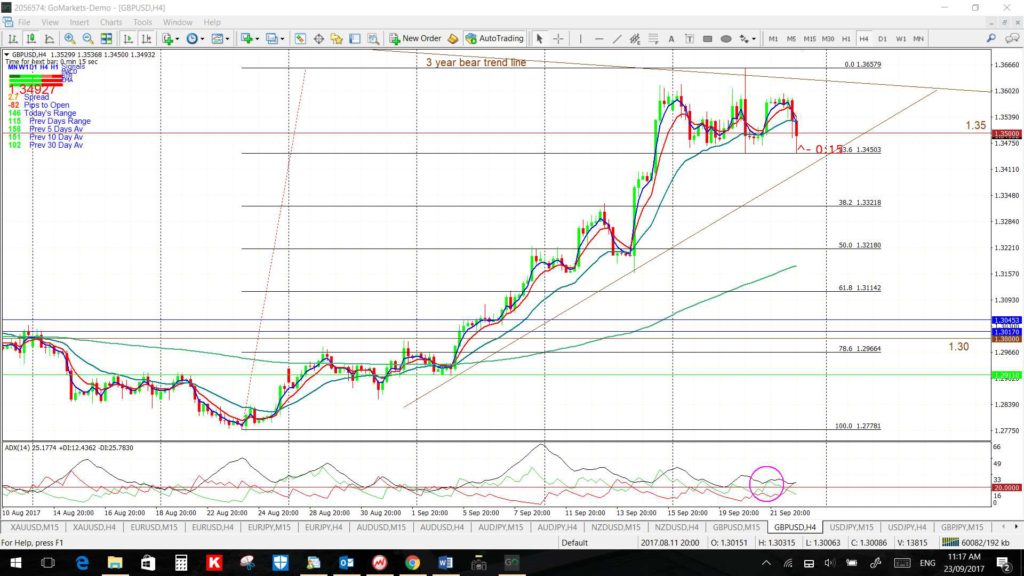
GBP/USD: The Cable spent the week consolidating around the key 1.35 S/R level and under the weekly chart’s 3-year bear trend line.
Watch the 1.35 level and 3-year bear trend line for any new make or break.
- Upper targets: any bullish hold above 1.35 and the weekly chart’s triangle trend line will have me looking to the weekly chart’s 61.8% fib, near 1.50.
- Lower targets: any bearish retreat will bring the 1.30 S/R level, as this is just below the 4hr chart’s 61.8% fib, and then the weekly chart’s support triangle trend line into focus.
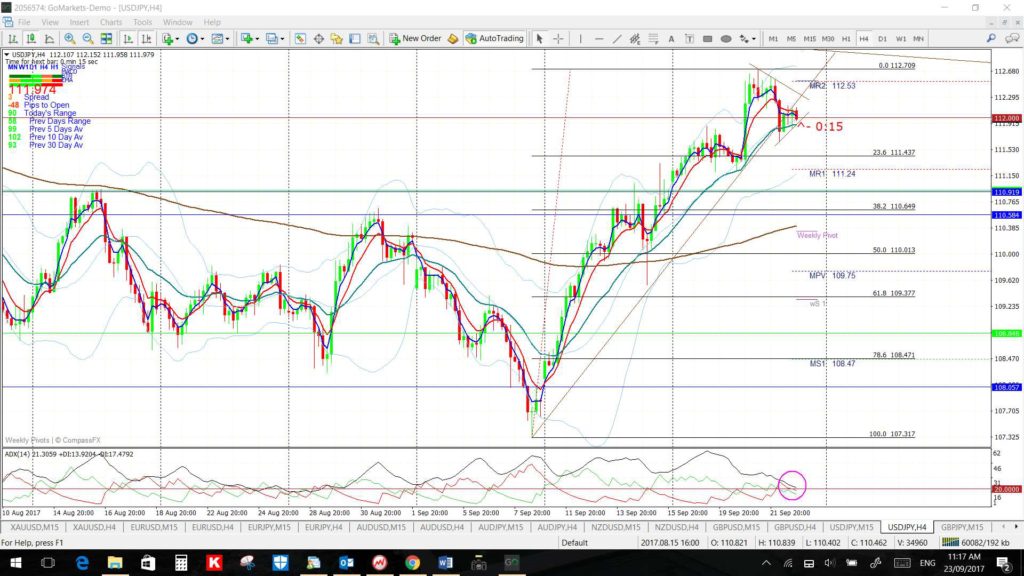
USD/JPY: The USD/JPY rallied up to close just under a 10-month bear trend line and the key 112 level. A two-week support trend line was broken on Friday but, for now, this also has some Bull Flag appearance so watch the Flag trend lines for clues here.
Watch the 4hr chart Flag trend lines for any new breakout move:
- Upper targets: any bullish breakout will bring the 114.50 level into focus.
- Lower targets: any bearish breakout will bring the weekly 200 EMA into focus.
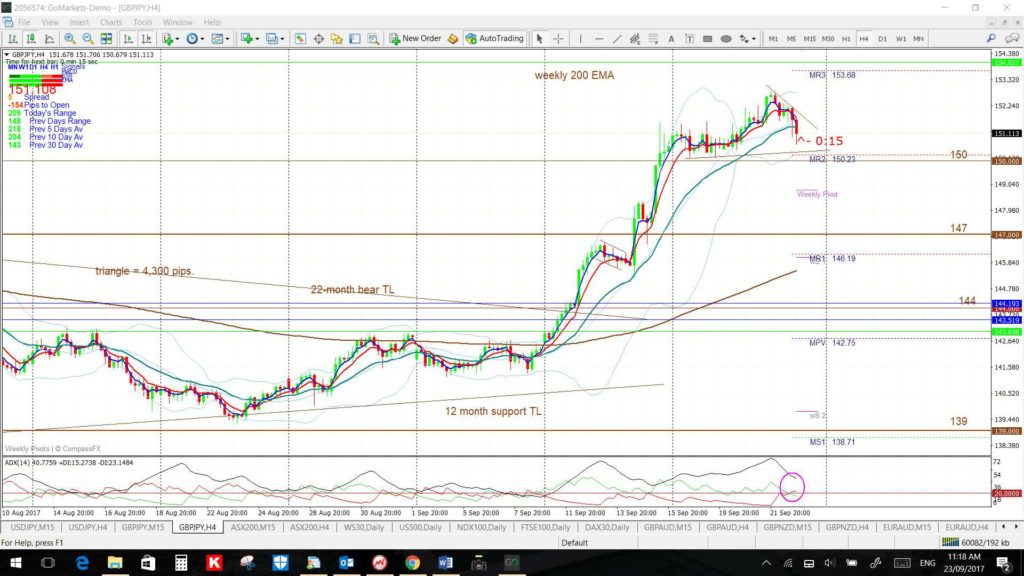
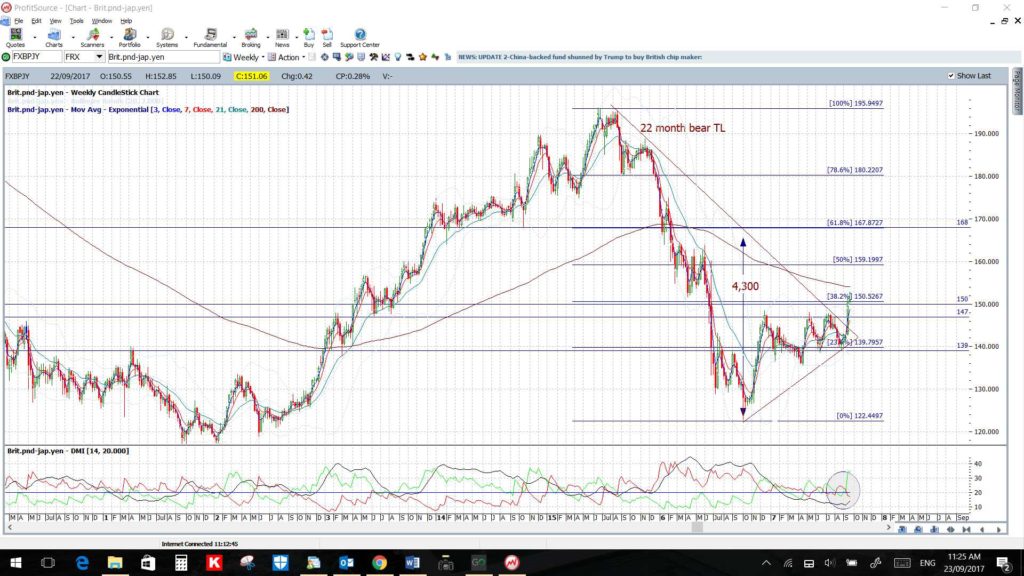
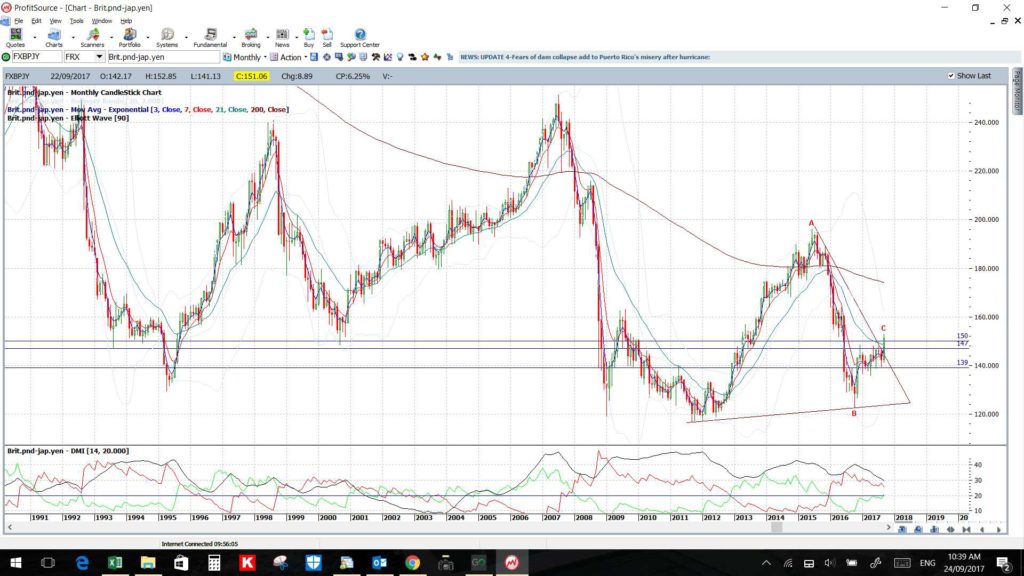
GBP/JPY: The GBP/JPY spent the week consolidating above the key 150 S/R level.
Note: the recent break of the monthly bear trend line triggered a triangle breakout that could be worth up to 4,300 pips.
Watch the 150 level for any new make or break:
- Upper targets: any bullish continuation above 150 level would bring the weekly 200 EMA and, then, the 160 level into focus as this is the weekly chart’s 50% fib.
- Lower targets: any rejection of 150 would have me looking for a test of the 147, 144 and the 139 S/R levels.
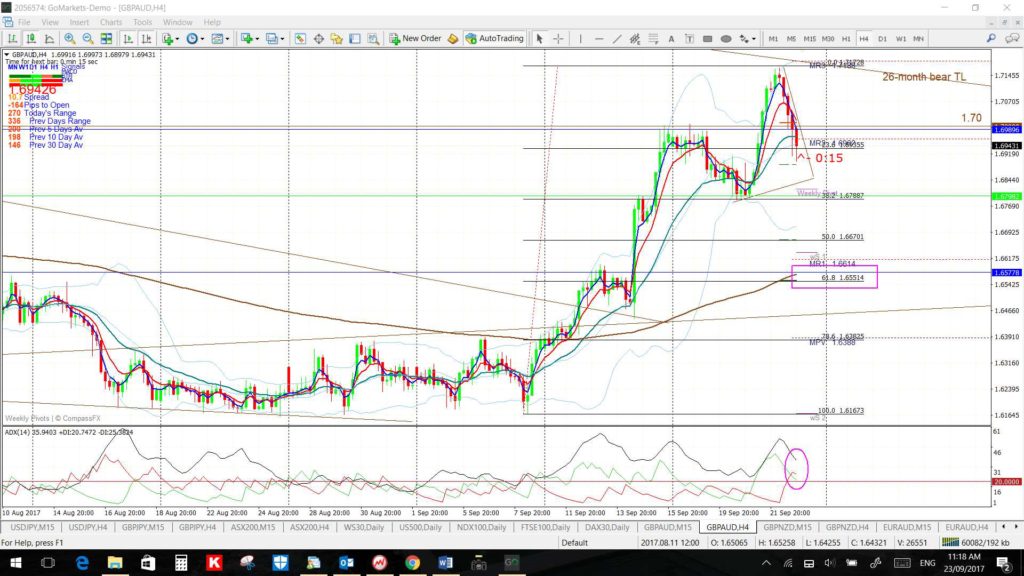
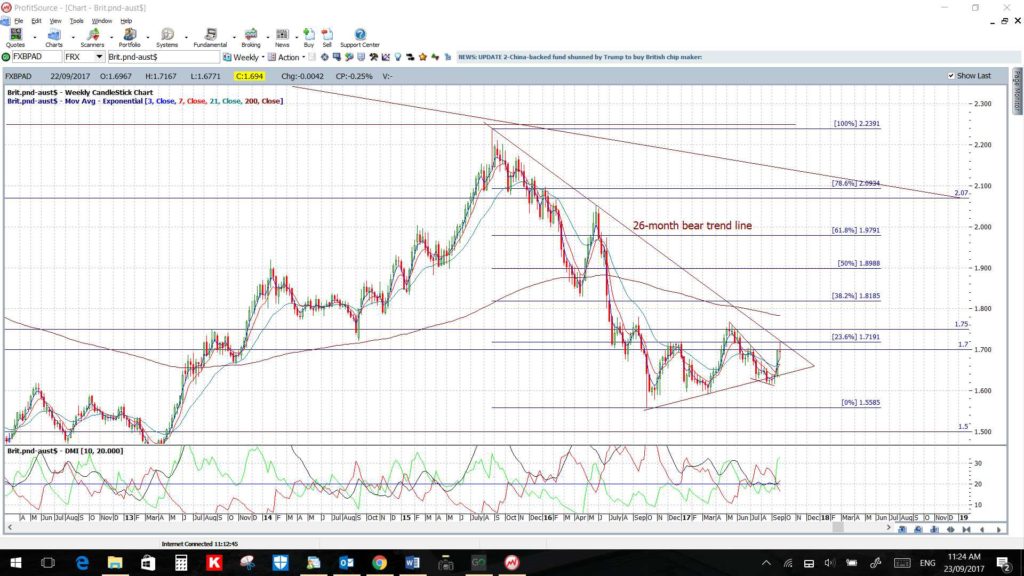
GBP/AUD: The GBP/AUD broke up through the 1.70 S/R level last week and then edged up to the 26-month bear trend line before pulling back to close the week out just below the 1.70 level.
Watch the 1.70 level and 26-month bear trend line for any new make or break:
- Upper targets: The 1.75 and 1.80 levels.
- Lower targets: the 4hr chart’s 61.8% fib, near 1.655 and the 4hr 200 EMA.
GBP/NZD: The GBP/NZD spent last week consolidating between the key 1.80 and 1.90 S/R levels.
Watch the 4hr chart’s triangle trend lines for any new breakout:
- Upper targets: Whole number levels, such as 1.90, on the way to the weekly chart’s 61.8% Fib near 2.20 S/R.
- Lower targets: A test of the 1.80 level.
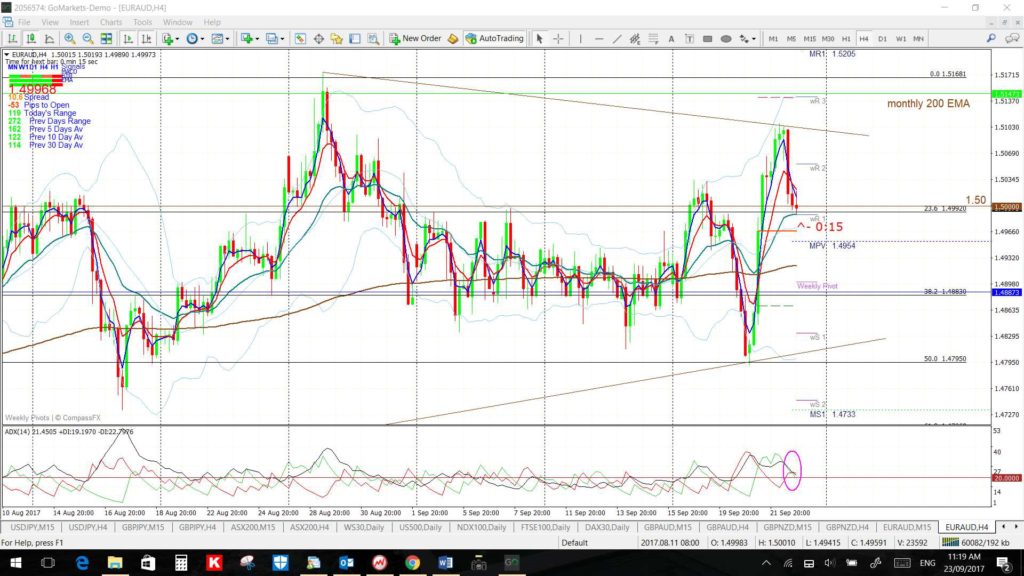
EUR/AUD: This pair has been very choppy around the key 1.50 level but note the weekly close right on top of this major S/R zone!
Watch the revised 4hr chart’s triangle trend lines for any new breakout:
- Upper targets: any bullish breakout would bring the monthly 200 EMA followed by the 9-year bear trend line and, then, the previous S/R level of 1.55 into focus.
- Lower targets: any bearish breakdown would bring the 4hr chart’s 61.8% fib, near 1.47, followed by the 1.40 S/R level into focus.
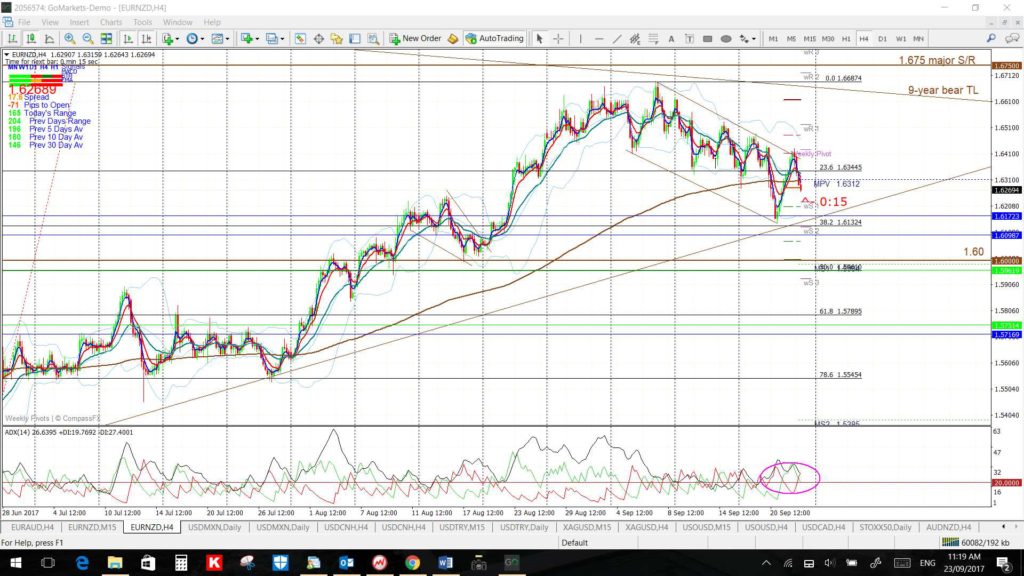
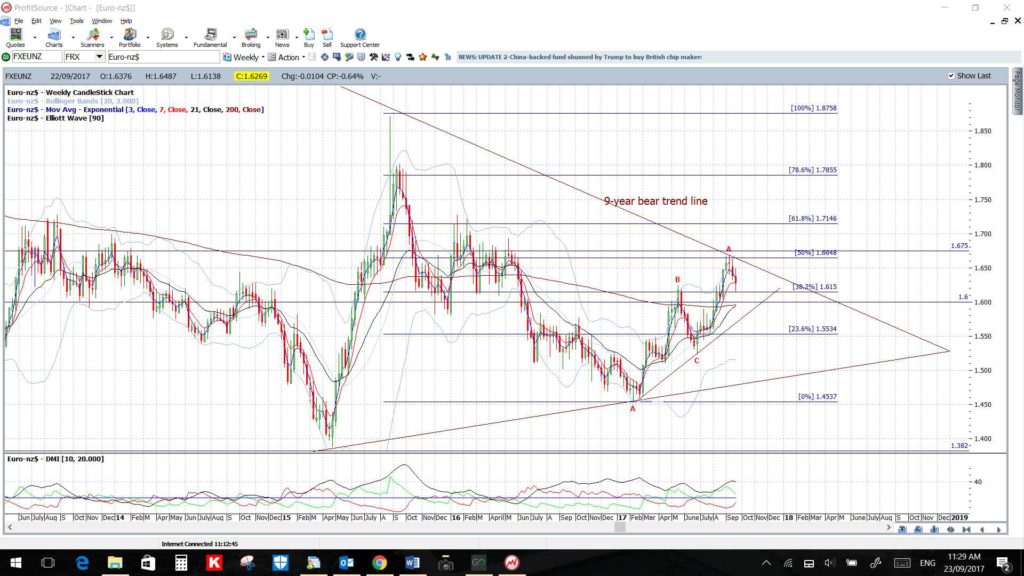
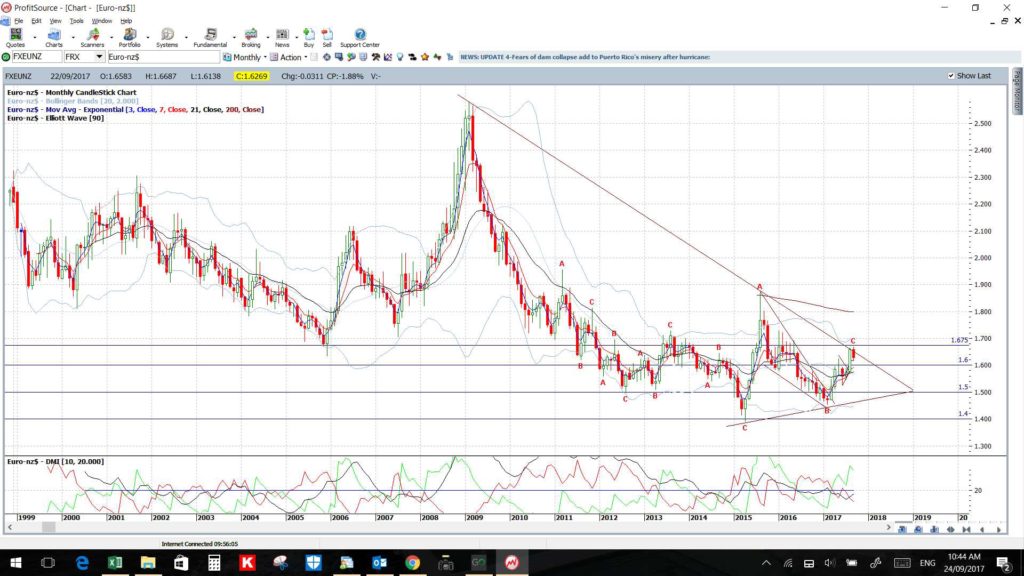
EUR/NZD: The EUR/NZD has spent yet another week consolidating below the 9-year bear trend line and 1.675 major S/R level.
Watch the 4hr chart’s Flag trend lines for any continued breakout move:
- Upper targets: any breakout will bring the 9-year bear trend line, then the 1.675 S/R level and, then, weekly chart’s 61.8% fib near 1.7 into focus.
- Lower targets: any retreat will bring 1.60 S/R into focus.
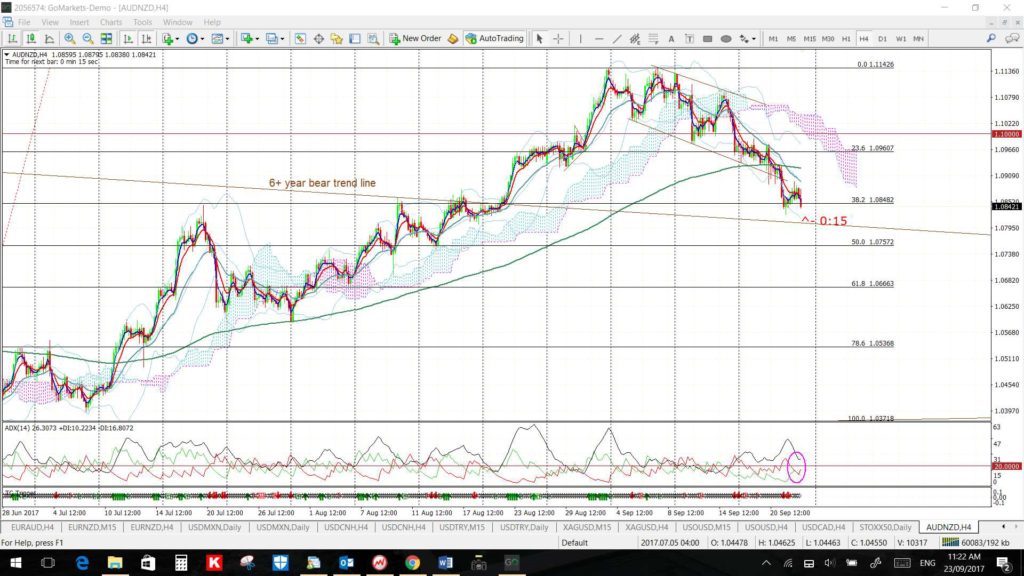
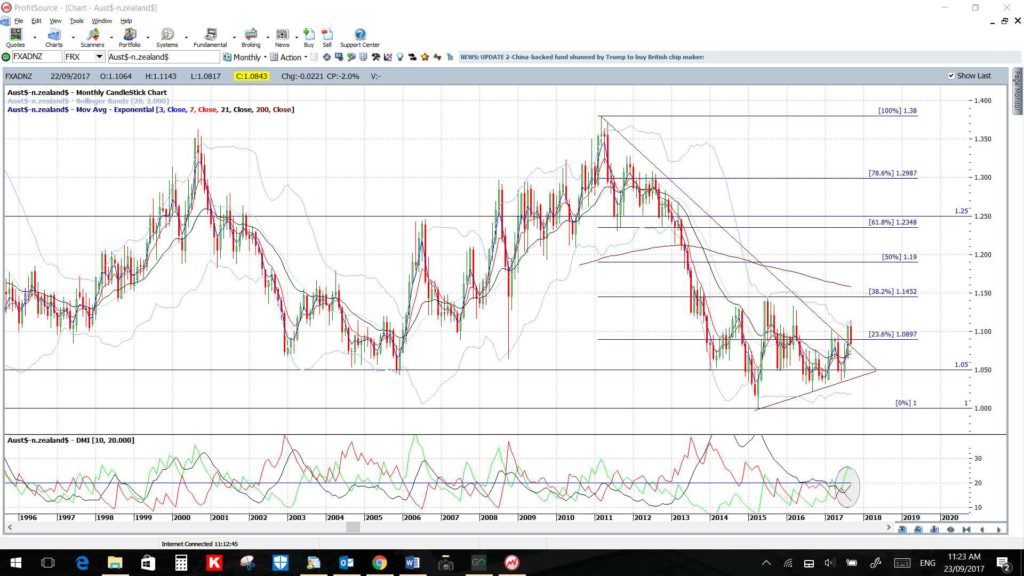
AUD/NZD: this pair is consolidating after breaking up through a 6-year bear trend line. Any hold above this previously broken resistance level would be very bullish and support a major corrective move:
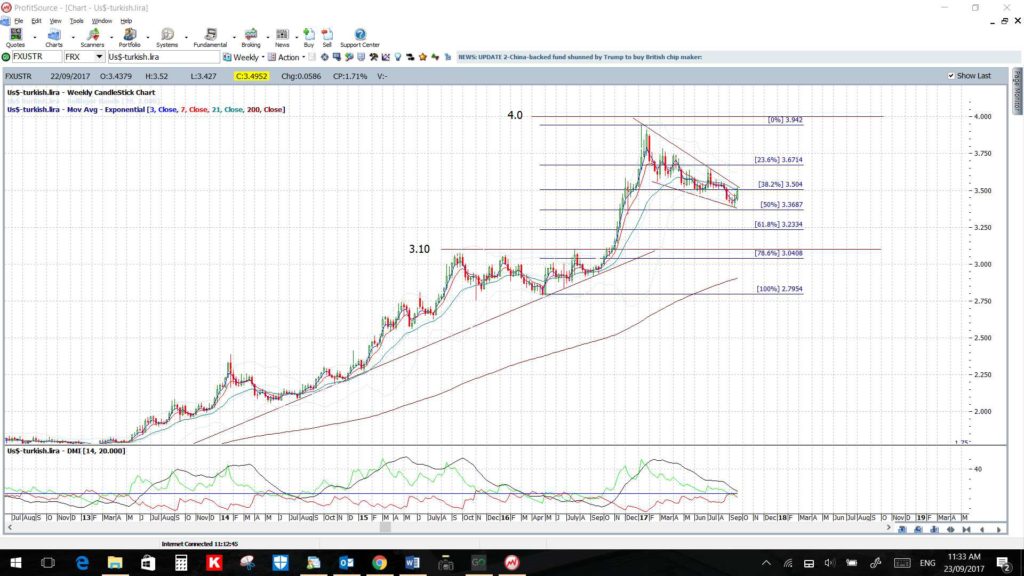
USD/TRY: This pair rallied last week back up to the weekly chart’s upper Flag trend line.
Watch the revised weekly chart’s Flag trend lines for any new breakout move:
- Upper targets: any bullish breakout will bring the daily chart’s 61.8% fib, near 3.75, into focus.
- Lower targets: any bearish breakout will bring the 4hr chart’s 61.8% fib, near 3.45, then the weekly chart’s 61.8% fib, near 3.25, and, after that, the 3.10 region as previous S/R into focus.
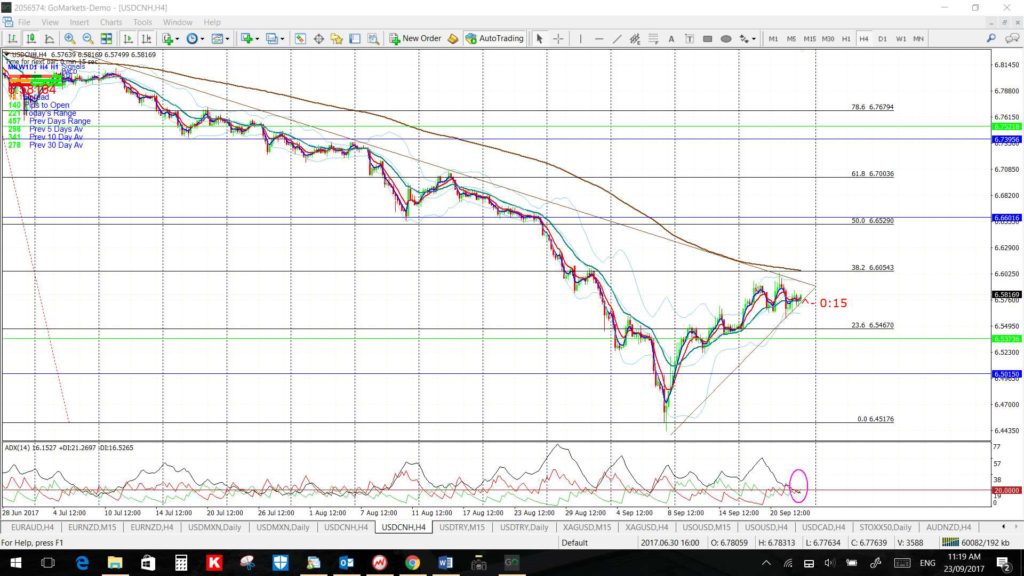
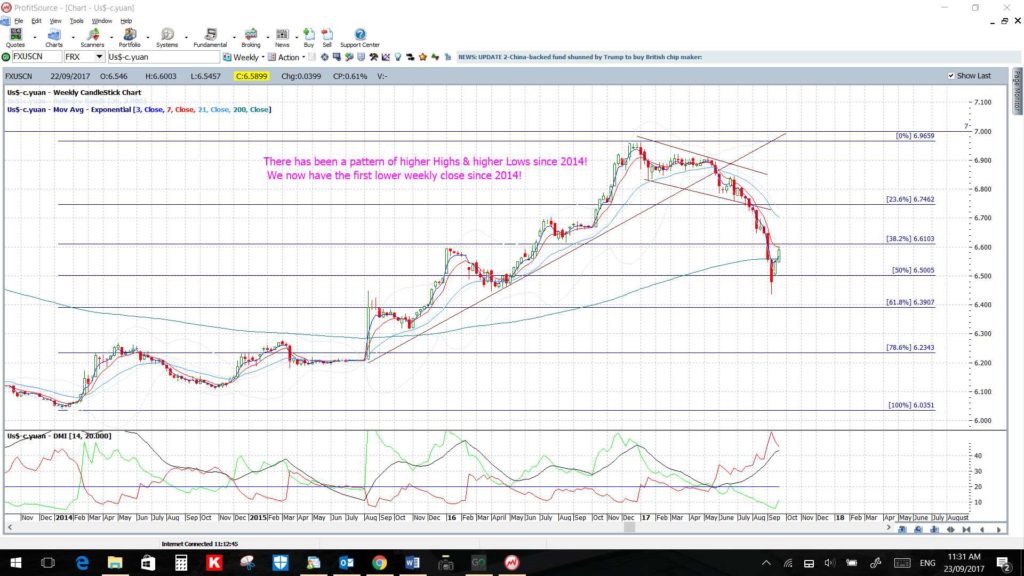
USD/CNH: This pair continues to respect a 13-week bear trend line and the 4hr chart’s 200 EMA.
Watch the revised 4hr chart triangle for any breakout move:
- Upper targets: watch for any bullish triangle breakout to target the 4hr chart’s 61.8% fib, near 6.70.
- Lower targets: any bearish breakdown would have me looking for a test of the recent low, near 6.45, followed by the weekly chart’s 61.8% fib; near the previous S/R level of 6.40.
Commodities:
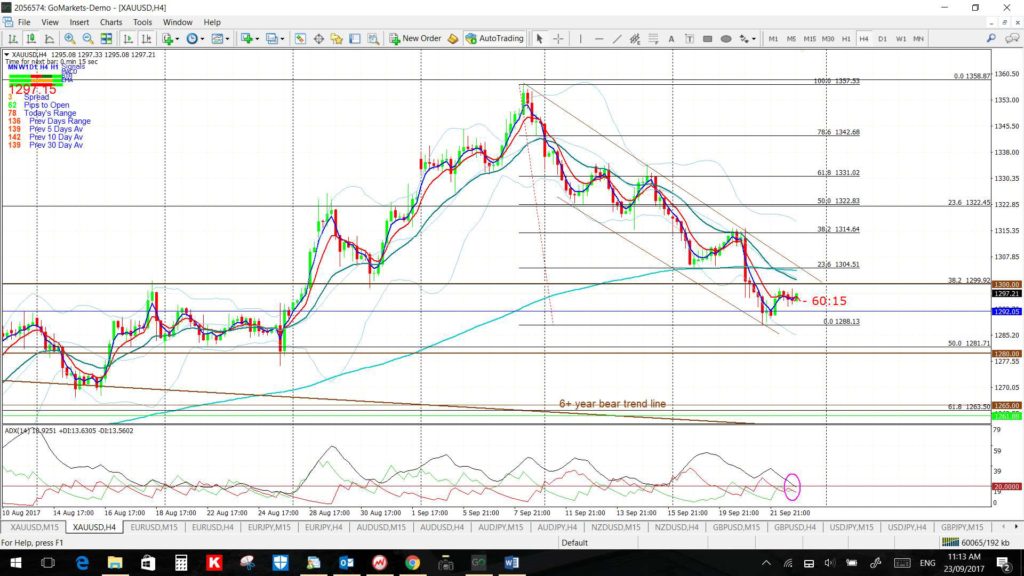
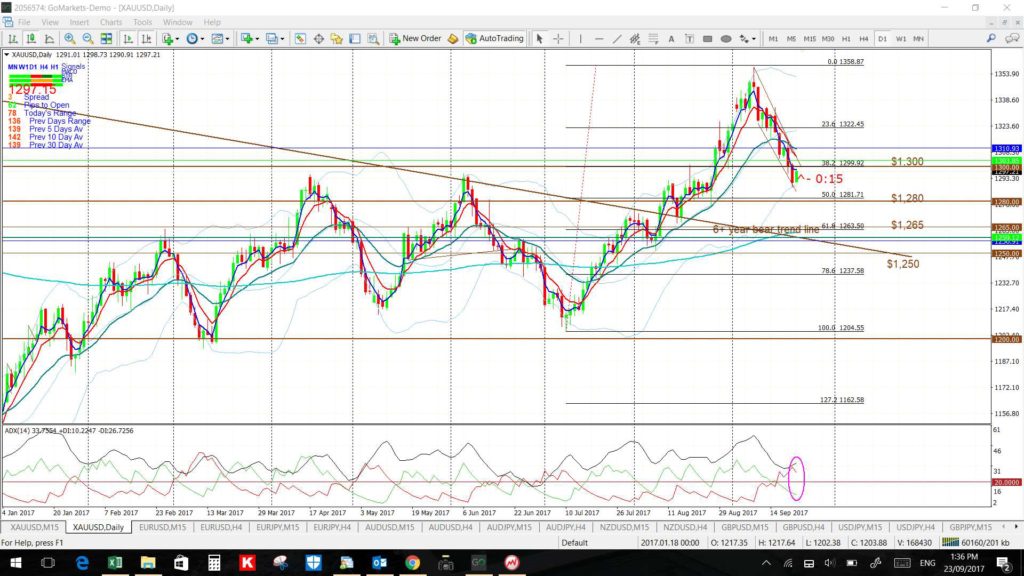
Gold: Gold suffered a pullback but last week but, whilst some commentators made much of this weakness, I think some perspective is required here. The metal had been on a tear for 9 weeks and, during this run, broke up through a major 6-year bear trend line. Thus, some pause or pullback would not be unexpected as trends do not travel in straight lines forever. The 61.8% fib of this 9-week swing high move is down near the $1,265 S/R level (see the daily charts) and this is also near the previously broken 6-year bear trend line. Thus, a pullback to test this region would not surprise me at all.
Watch the 4hr chart’s channel trend lines and $1,300 level for any new breakout:
- Upper targets: any bullish break will bring the 4hr chart’s 61.8% fib, near $1,330, then the $1,400 S/R level and then the weekly chart’s 50% fib, near $1,485 and then the weekly chart’s 61.8% fib, near $1,600 into focus.
- Lower targets: any bearish retreat will bring the daily chart’s 61.8% fib, near $1,265 S/R and the 6-year bear trend line, followed by the $1,250 level into focus.
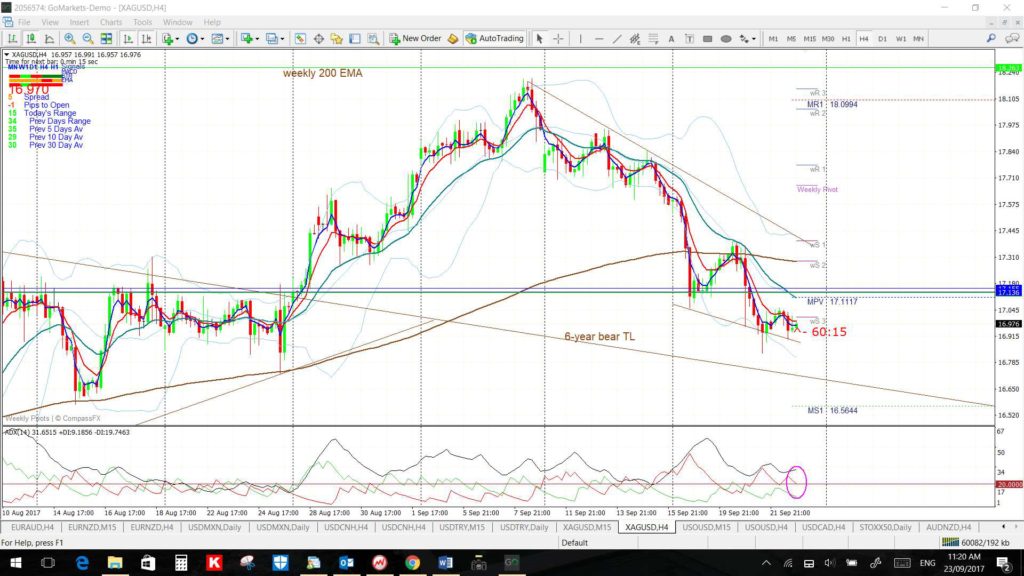
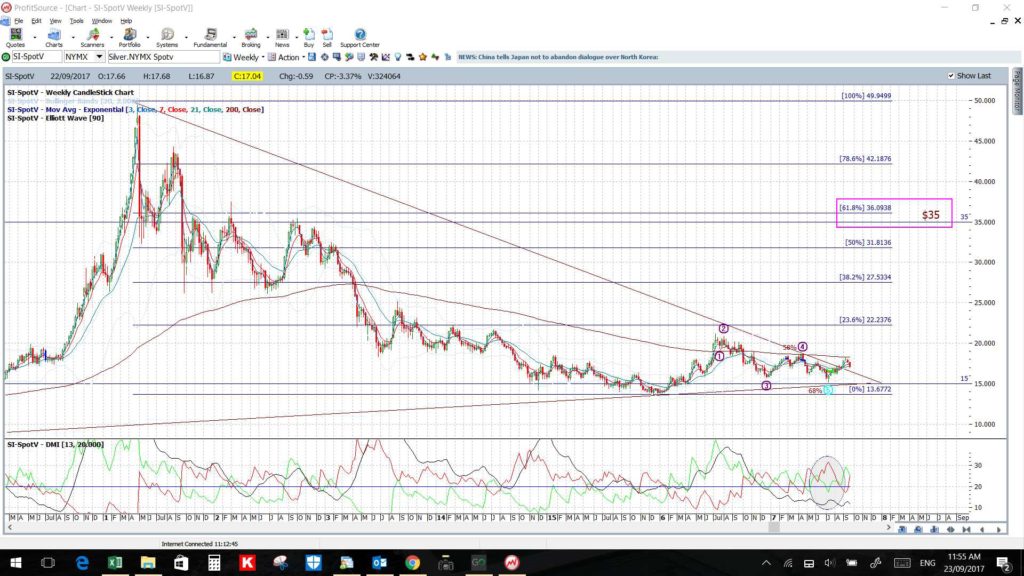
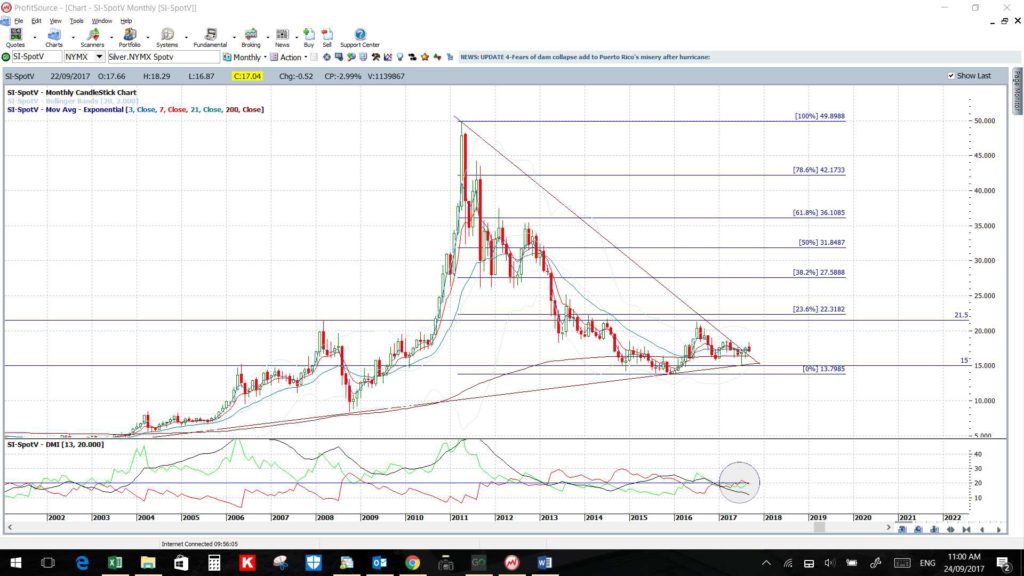
Silver: Like with Gold, Silver pulled back last week but continues to hold above the previously broken 6-year bear trend line.
Watch the 4hr chart wedge trend lines for any new breakout:
- Upper targets: any bullish breakout will bring whole number levels and the weekly chart’s 61.8% fib, near $35, into focus.
- Lower targets: any bearish retreat will bring whole-number levels down to $15 into focus.
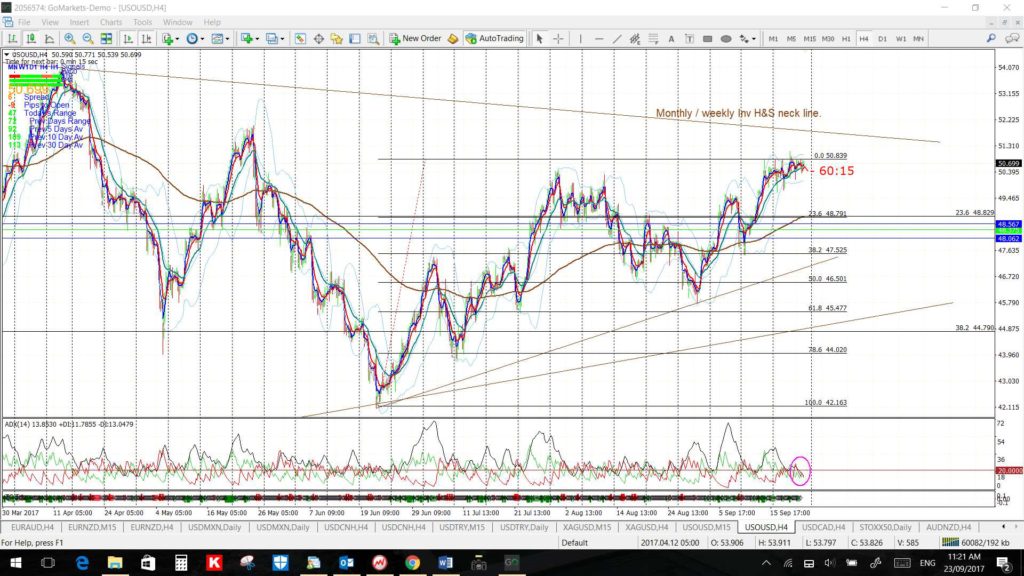
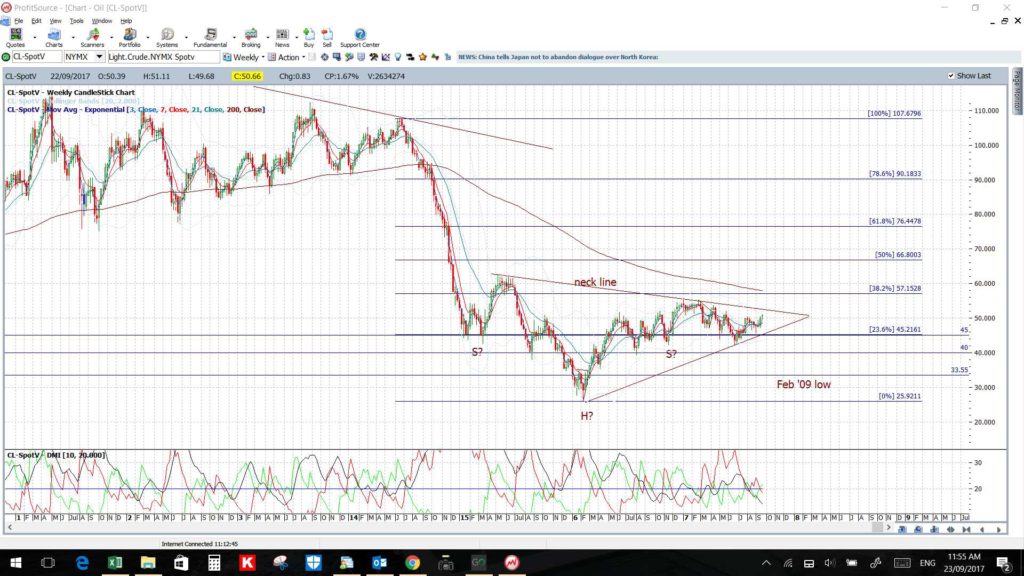
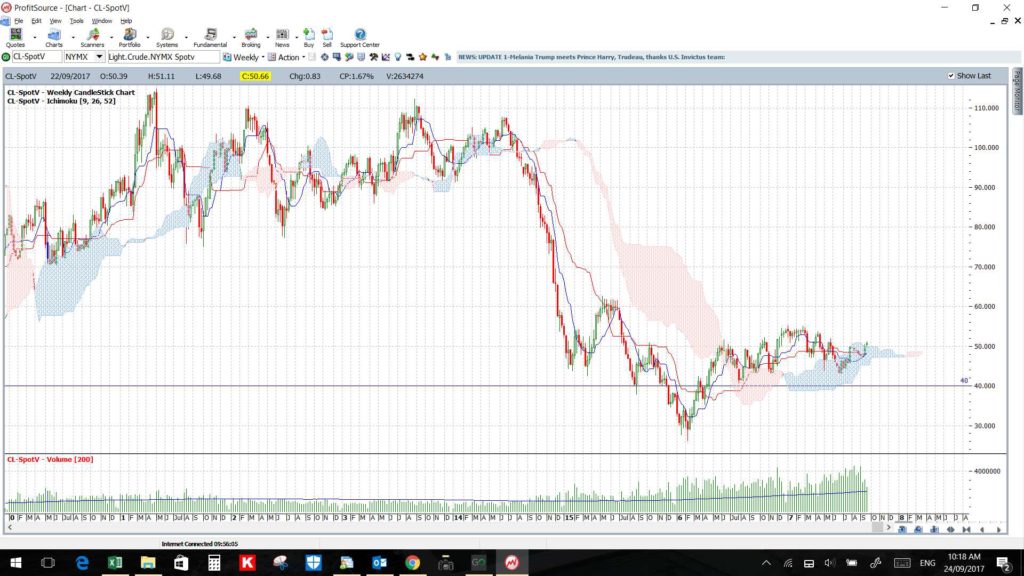
Oil: Oil spent the last week consolidating near the major $50 S/R level but managed to close the week above this psychological zone. It is also back above the weekly Cloud which is bullish.
Watch the 4hr chart triangle trend lines for any new breakout:
- Upper targets: the major weekly chart Flag trend line followed by the $60, $65 and $70 whole-number levels and, then, the weekly chart’s 61.8% fib near $75.
- Lower targets: any bearish retreat will bring the 4hr chart’s swing high 61.8% fib, near $45, then the recent low, near $42, and then the $40 S/R level into focus.
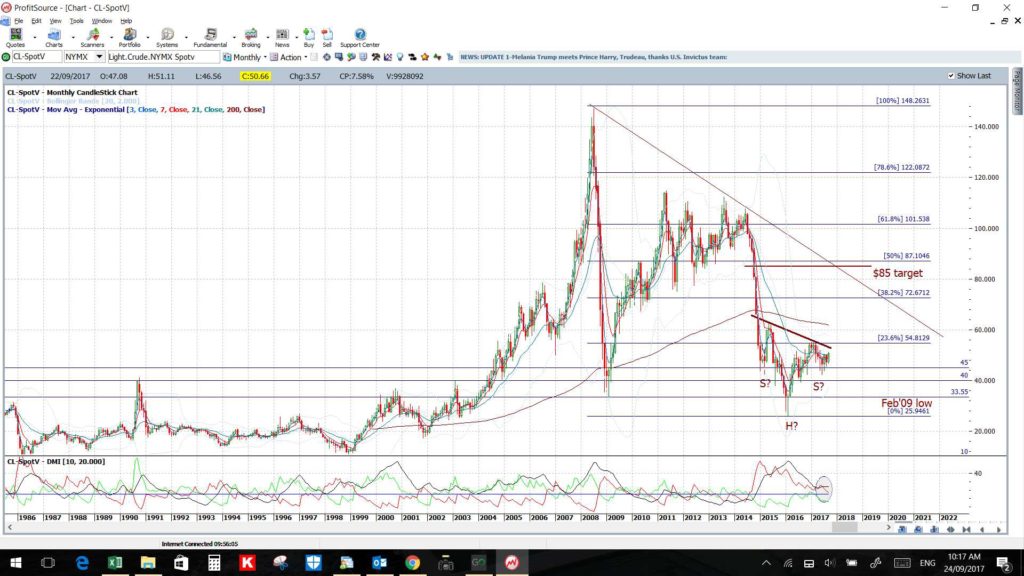
Note: There is 2-year bear trend line above current price and this also forms the monthly chart’s ‘Neck Line’ for a potential ‘Inverse H&S’ pattern. This pattern has a height of approximately $30 or 3,000 pips and this puts the target for any breakout move up near the $85 level which ties in with the 50% Fibonacci of the 2008-2016 swing low move.

